Download
1 / 15
170 likes | 185 Views
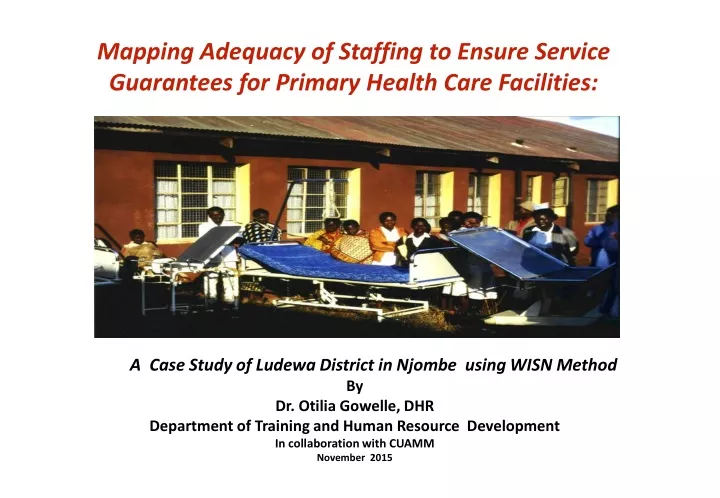
Mapping Adequacy of Staffing to Ensure Service Guarantees for Primary Health Care Facilities:. A Case Study of Ludewa District in Njombe using WISN Method By Dr. Otilia Gowelle, DHR Department of Training and Human Resource Development In collaboration with CUAMM November 2015.

E N D
Mapping Adequacy of Staffing to Ensure Service Guarantees for Primary Health Care Facilities: A Case Study of Ludewa District in Njombe using WISN Method By Dr. Otilia Gowelle, DHR Department of Training and Human Resource Development In collaboration with CUAMM November 2015
Context and Background HSSP IV has provided certain targets to provide universal health coverage MMAM promises for a village level to have dispensary, Ward level to have a HC, and District level to have a Hospital HRH is important for morbidity and mortality reduction Demand vs. Supply of workforce is not tallying
Our Big Concern: Is there adequate staffing to offer quality Services in health care facilities to meet the service guarantees under HSSP IV and MMAM?
About WISN Method WISN- Workload Indicators of Staffing Need A method of setting the correct Heath Facility staffing levels. Developed by Shipp (1998) and popularized by WHO Tried in Tanzania, Papua New Guinea, Kenya, Botswana, Namibia, Zimbabwe, Hong Kong, Turkey and Bangladesh
Advantages Optimal Allocation and deployment of current staff geographically according to volume of services Optimal Allocation and deployment of current staff functionally between the different types of health facilities or different health services in district Staffing patterns and levels (categories and numbers) in individual health facilities according to local conditions (morbidity, access, attitudes) and not based on national averages (population ratios and standard staffing schedules) Useful for both medical and non-medical administrators at all levels of the health service Simple to operate and use, technically acceptable, comprehensible and realistic so that results are acceptable by non clinical manager.
What has been done so far? Training of trainees (TOT) has already been organized and training in each step of the WISN method. Orientation has been done to Expert working groups from regions and districts and Workload components and Activity standards have been developed for data collection WISN study has been piloted in Ludewa, Shinyanga and Sengerema District
WISN Steps Chart Interview & FGD IPHS HMIS & Secondary data Total demand Time required for procedure Service guarantees Proportion of population requiring services X X = Interview & FGD HMIS/Record review Total supply of staff time Time available per worker Personnel strength = X Total demand Total supply of staff time Surplus/Gap _ = Step-I Step-II Step-III
WISN calculated per Dispensary, ownership and level, for maternity activities-specific cadre related
WISN calculated per Health Centre, ownership and level, for maternity activities-specific cadre related
Conclusion The WISN difference column gives us a mean of 0.78 and 0.82 for Public and PNFP Dispensaries and 0.68 versus 0.53 for Public and PNFP HCs respectively. It means the activities performed at martinity level would only need a fraction of the person actually posted for the purpose. In other words the maternities are overstaffed by 20% at Dispensaries and 40% (in mean) at HC level. Conversely, the WISN ratio column gives us a mean of 6.92 and 6.40 for Public and PNFP Dispensaries and 3.6 versus 2,2 for Public and PNFP HCs respectively. A WISN ratio equal to 1 means the workload is in balance with the staff posted, the greater the WISN ratio(>1) the lower the workload preassure on the staff as what refers to the current service utilisation.
Resuming the assessment results: • The maternity services are overstaffed by 20% at Dispensary and 40% at HC level(mean) or conversely the staff is performing 80% and 60% of the work given the HW’s available annual working time. • The utilisation of service is poor as the staff performs around 80% and 60% (mean) of the work that could be done given the available annual working time
Recommendations In the presence of government promises to deliver a minimum package of services, the WISN method should be used as a methodology to calculate the expected demand as well as supply and the gap. Government health planners should use WISN data to consider the magnitude of staffing increases that would be needed to meet service guarantees. Our study generated time standards in minutes for each MCH activity developed by experts of the MoHSW. These standards could now be applied to other districts in 16 BRN Regions with slight modification if required. WISN, then, can provide a useful tool for civil society advocates who seek to hold governments accountable for their health service guarantees.