Download
1 / 45
450 likes | 733 Views
Colorado Lottery Scratch Player Segmentation Study. Presentation by Simon Jaworski March 1 st 2012. Thought process into Segmentation Methodology Profile of respondents High level view and comparison of Segments Detailed Segment Analysis Strategic Conclusions Questions.

E N D
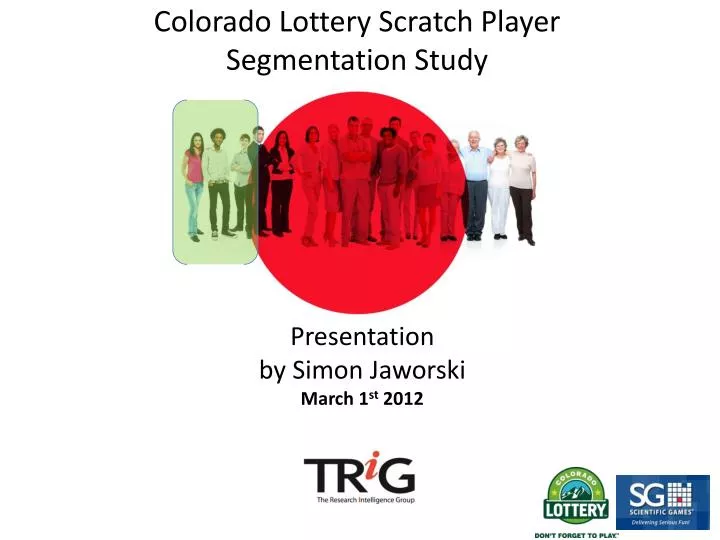
Colorado Lottery Scratch Player Segmentation Study Presentation by Simon Jaworski March 1st 2012
Thought process into Segmentation Methodology Profile of respondents High level view and comparison of Segments Detailed Segment Analysis Strategic Conclusions Questions
Analytical Methodology: Multi-Domain Segmentation Actionability is the key to any segmentation approach, indeed to all market research. To be successfully actionable, a Scratch Player segmentation study must address the following three key criteria. • What Lottery Scratch Players Do? • Why They Do It? • Who These Scratch Players Are?
TRiG’s objectives for the Colorado Lottery Scratch Player Segmentation Study were to : 1. Allow the Lottery to use information attained in the segmentation study for strategic planning, product development, product enhancements, pricing, market positioning and communications within the Scratch Ticket market. It is anticipated that this data will help the Lottery maximize revenue potential and minimize risk associated with new product introductions and product enhancements for Scratch games. 2. Learn the values, attitudes, motivations and Scratch game buying behavior of Colorado Past Year Scratch playing adults, which results in a division of the public into categories known as segments. 3. Find Scratch segments that could be easily understood and differentiated from one another. Factors that we assumed would be assessed, but were not limited to, included geographic, demographic, socioeconomic, lifestyles, motivations and product usage.
Methodology: • Colorado respondents participated in a 35 minute survey in December, 2011. • 985 Scratch players completed the online survey. • 469 players were taken from the general population. • 516 players were taken from the Colorado Lottery ‘MyLottery’ players club • The respondents all had to: • Be older than 18 years of age • have no moral objections to Colorado running a state lottery • not work for an advertising agency, market research company, marketing consultant, any type of Lottery or a store that sells lottery tickets • Margin of Error – Statistical Sample Accuracy at 90% confidence on n=985 completes is + or – 2.6%
Scratch Segment Sketches ‘RIBS’, Ritual Budgeters “RIBS are the oldest segment and are very focused on the bottom line. Not surprisingly, they are more likely to be retired than the other player groups. RIBS are less concerned with large jackpots and more interested in the cost of their tickets. Lottery is a weekly ritual for them. RIBS play their lucky numbers, prefer to win cash and play games with lots of top prizes available. This groups values privacy and courtesy and is the most religious of our segments. ” ‘BLAZERS’, Trailblazers. “The most youthful and diverse segment, both racially and ethnically, Trailblazers are the most active and highest spending players. They enjoy risk, believe in fate and have an optimistic worldview. Trailblazers have the second highest average income of the segments, are brand loyal and spontaneous. They consider themselves leaders and are not concerned with what others thinks of them. Trailblazers value their independence and plan for the future.”
Scratch Segment Sketches (2) BLAHS: Don’t Know, Don’t Care “The Blahs have middle of the road opinions about most values and a somewhat negative view of the lottery. They are the least likely to see the benefits that the lottery brings to the state. Blahs are somewhat conservative, but dream of winning big- exhibiting a motivation to play when jackpots reach $100 MM. That said, Blahs have the lowest playership and spend numbers. They don’t think of the lottery as immoral, but are the most disengaged segment.” FUN FACTS: Fun, Active Scratchers “ FACTS are motivated by fun. They are very active and they spend free time enjoying the outdoors. FACTS play drawing games when the jackpots are high and purchase their tickets in c-stores. They are the most affluent segment, the most likely to be currently employed and the most likely to buy Lottery tickets as gifts. FACTS appreciate the benefits that the Lottery brings to the state, as well as the entertainment value of the games on a personal level.”
Distinguishing Characteristics of each segment* High High Low Low www.trig-us.com
Distinguishing Gaming & Lottery Attitudes of each segment* High High Low Low www.trig-us.com
Distinguishing Jackpot/Drawing Game Play of each segment* High High Low Low www.trig-us.com
Distinguishing Scratch Game Play for each segment* High High Low Low www.trig-us.com
Distinguishing Demographics of each segment* High High Low Low www.trig-us.com
11% PAST MONTH PLAY: 78% PAST WEEK PLAY: 52% Spend per Month $129 #1 • Highest spenders • Smallest segment size • Lottery lovers GAMES THEY PLAY www.trig-us.com
Values (Sec B) • Planning for the future Independence • Family NOT ‘Privacy’ Colorado Lottery Benefits, Issues & Proceeds (E2,3,4) • Keeps money in the State (65%) #2 • Provides jobs (42%) #1 • Pays for economic development (39%) #1 • Lowers taxes (37%) #1 • None (36%) #1 • Schools/Teachers/Education (61%) #1 • Reduce taxes (46%) #1 • Fish and wildlife management (36%) #1 Who are they? • Age skews youngest • Most racially diverse segment (24% minority) • 2nd highest average income ($60K) What are their thoughts on life? (Sec A) • Believe in working hard for what they earn (99%) #1 • Enjoy giving gifts to others (96%) #1 • Seek out all relevant facts before making decision (89%) #1 • Like to try new products (86%) #1 • Do exciting things (83%) #1 • Important to save for retirement (83%) #1 • Like to be entertained (79%) #1 • Don’t care about what others think of them (72%) #1 • Optimistic about the future (73%) #1 • Brand loyal (67%) #1 • Others consider me a leader (66%) #1 • Spontaneous person (64%) #1 • Challenging activities are most fun (67%) #1 SEGMENT 2: BLAZERS www.trig-us.com
Play - Past MonthYear56%79% 37%53% 50%74% 28%42% 24%37% Average Spend Per PlayPer Month(among players) $10 ($13) $23 ($30) $7 ($13) $14 ($26) $9 ($13) $20 ($27) $4($11) $10 ($23) $4 ($11) $9 ($26) Key Drawing attributes #1 reasons/differentiators Dream of Winning Big When the Jackpot is High Cost of Ticket SEGMENT 2: BLAZERS • Drawing Game Attitudes (F1) • I prefer to let the computer pick my numbers (67%) #1 • I enjoy playing in a pool because it gives me more chances to win (40%) #1 • I realize in a pool group my portion of the jackpot would be lower than my trigger amount that I buy myself. (63%) #1 www.trig-us.com
PAST YEAR PLAYERSHIP BY TICKET $ $1$2$3$5$10$20 % play: 34% 36% 31% 48% 26% 20% Rank #4 #4 #2 #1 #1 #1 Past Year: 100% Past Month: 78% Past Week: 52% “FAVORITE SCRATCH GAMES” by $ Key Scratch attributes #1 reasons/differentiators Cost of ticket Top prize amount Odds of winning SEGMENT 2: BLAZERS Spend per play: $16 Spend per month: $54 • Scratch Game Attitudes (G9) • I like scratch games because you know you have won immediately. (93%) #1 • The prizes on Scratch games give me the feeling of a “winning experience” (92%) #1 • I expect a bigger prize when I buy a higher price point Scratch ticket (89%) #1 • I see Scratch Games as a form of entertainment in addition to a chance to win a prize a win (89%) #1 • I would be likely to purchase a ticket with a top prize other than money (82%) #1 • The first thing I notice when I look at Scratch Games is the Top Prize (78%) #1 • I prefer Scratch Games with a big top prize (75%) #1 www.trig-us.com
“Where do they purchase?” Convenience 74% #4 (64% most often) grocery 54% #1 Liquor 15% #1 “DAYS OF THE WEEK PLAY” % Monday 38% #1 Tuesday 41% #1 Wednesday 46% #4 Thursday 32% #1 Friday 56% #1 Saturday 51% #4 Sunday 24% #1 “DAY Play MOST OFTEN” - % Friday 25% Saturday 23% Wednesday22% SEGMENT 2: BLAZERS • Lottery & Gaming Attitudes (C1 & D2) • It is important to me that proceeds from the lottery go to a good cause (94%) #1 • The CO Lottery has done a good job raising money for CO programs (87%) #1 • I would vote for the Lottery if there was an election today (81%) #1 • The Lottery is fun (90%) #1 • Everyone who purchases a ticket to play the CO Lottery has an equal chance of winning (87%) #1 • Even if it is a small prize, I really enjoy winning something from the Lottery (91%) #1 • I buy tickets to win money (82%) #1 • I like the idea of winning a new car (81%) #1 • When I bet money I want to be entertained as well as have a chance to win a prize (81%) #1 www.trig-us.com
VISIT Colorado Lottery website? 85% Ever #1 48%/67% Past Week/Month #1 71% (T3B) Excellent website Internet Use per week 12 hours personal 10 hours professional Social Media – 57% use it daily 5 Hours Per Week #1 73% #1 41% #1 36% #1 13% #2 = 15% #1 Social Media Product/Brand Promotions 30% interested #1 Media Habits • 52% own a Smartphone #1 • 53% own Gaming Console #1 • 22% own tablet computer #1 • 36% play Online games #1 • 63% read a newspaper #1 TV - 17 Hours per week 67% 50% 48% 46% 38% 34% 32% 28% Radio – 5 Hours per week • Rap/Hip Hop 24% #1 • Classic Rock 27% #4 • Current Rock 27% #4 • Country/Western 29% #4 SEGMENT 2: BLAZERS www.trig-us.com
Other Gaming activities Sweepstakes – 67% #2 Casino– 61% #2 Slots – 56% #3 Raffle – 50% #2 Video Poker – 38% #1 Bingo – 37% #1 Hobbies & Interests 50% 50% 41% 34% 33% 30% 21% 20% 19% 19% 18% 16% 15% SEGMENT 2: BLAZERS www.trig-us.com
PAST MONTH PLAY: 71% PAST WEEK PLAY: 48% Spend per Month $70 #2 • Third largest segment of the Colorado Lottery Scratch playing population. • Second highest Monthly spenders on average. GAMES THEY PLAY www.trig-us.com
Values (Sec B) • Financial Security Privacy • CourtesyNOT ‘Others opinion of me’ Colorado Lottery Benefits, Issues & Proceeds (E2,3,4) • Proceeds go to GOCO (71%) #1 • Keeps money in the state (60%) #3 • Chance to win money (58%) #4 • Bring in other state’s money (23%) #1 • People who can’t afford play anyway (35%) #1 • People spend money that should go to other things (31%) #2 • Too many expenses/not enough profit (11%) #1 • Schools/Teachers/Education (55%) #4 • Reduce taxes (43%) #2 Who are they? • The RIBs segment skews older • Lowest % Hispanic (17%) • Lowest average income ($50K) • Looks out for #1 and their budget What are their thoughts on life? (Sec A) • Believe in working hard for what they earn (94%) #2 • Enjoy giving gifts to others (92%) #2 • Seek out all relevant facts before making decision (87%) #2 • Pay for advice from psychics is a waste of money (79%) #1 • Like to get best deal before buying (81%) #2 • Have to look out for themselves because government won’t (72%) #1 • Important to save for retirement (75%) #2 • Like to be entertained (65%) #2 • Spend less on entertainment due to the current economy (65%) #2 • Investing in stock market is riskier than it used to be (71%) #2 SEGMENT 1: RIBS www.trig-us.com
Play - Past MonthYear46%75% 27%48% 48%74% 18%38% 15%31% Average Spend Per PlayPer Month(among players) $6($8) $12 ($16) $3 ($7) $8 ($16) $5 ($6) $9 ($12) $2($5) $4($10) $2 ($7) $4 ($14) Key Drawing attributes #1 reasons/differentiators I Dream of Winning Big Cost of Ticket When the Jackpot is High SEGMENT 1: RIBS • Drawing Game Attitudes (F1) • I realize in a pool group my portion of the jackpot would be lower than my trigger amount that I buy myself. (56%) #2 • I decide which numbers I will play before I go into the store (24%) #2 • I buy my tickets at the same retailer every time (25%) #2 • I buy my tickets the same day as the drawing (19%) #2 www.trig-us.com
PAST YEAR PLAYERSHIP BY TICKET $ $1$2$3$5$10$20 % play: 53% 41% 30% 45% 20% 12% Rank #2 #2 #4 #2 #2 #2 Past Year: 100% Past Month: 71% Past Week: 48% “FAVORITE SCRATCH GAMES” by $ Key Scratch attributes #1 reasons/differentiators Cost of Ticket Top prize amount Odds of Winning SEGMENT 1: RIBS Spend per play: $12 Spend per month: $33 • Scratch Game Attitudes (G9) • I have a set budget for Scratch Games every time I buy them (100%) #1 • I like scratch games because you know you have won immediately. (75%) #2 • I expect a bigger prize when I buy a higher price point Scratch ticket (69%) #2 • The first thing I notice when I look at Scratch Games is the Top Prize (46%) #2 • I prefer Scratch Games with a big top prize (45%) #2 • The prizes on Scratch games give me the feeling of a “winning experience” (45%) #2 • The first thing I notice when I look at Scratch Games is the name of the game (42%) #2 • I like Scratch tickets that take a while to play (39%) #2 • I would like to be able to buy a Scratch ticket on an IPhone/Ipad/Tablet (78%) #4 B2B www.trig-us.com
“Where do they purchase?” Convenience 76% #3 (68% most often) grocery 48% #3 Liquor 12% #3 “DAYS OF THE WEEK PLAY” % Monday 26% #3 Tuesday 33% #4 Wednesday 50% #2 Thursday 25% #4 Friday 47% #4 Saturday 56% #2 Sunday 22% #3 “DAY Play MOST OFTEN” - % Saturday 27% Friday 24% Wednesday24% “QUOTE” SEGMENT 1: RIBS • Lottery & Gaming Attitudes (C1 & D2) • Everyone who purchases a ticket to play the CO Lottery has an equal chance of winning (76%) #2 • The Lottery is a form of gambling (75%) #1 • When I bet money I want to be entertained as well as have a chance to win a prize (69%) #2 • The Lottery has been an overall benefit to the state of Colorado and its citizens (68%) #2 • Having a CO Lottery means keeping money in Colorado (68%) #2 • I would rather win cash vs. a trip or other non-cash prizes (83%) #1 • Even if it is a small prize, I really enjoy winning something from the Lottery (78%) #2 • I buy tickets to win money (75%) #2 www.trig-us.com
VISIT Colorado Lottery website? 80% Ever #4 37%/64% Past Week/Month 73% (T3B) Excellent website #1 Internet Use per week 13 hours personal 7 hours professional Social Media – 40% use it daily 4 Hours Per Week #3 68% #3 34%#2 30% #4 12% #4 7% #4 Social Media Product/Brand Promotions 24% interested #3 Media Habits • 37% own a Smartphone #4 • 38% own Gaming Console #4 • 12% own tablet computer #4 • 63% read a newspaper #2 TV - 15 Hours per week 68% 53% 51% 49% 40% 36% 35% 32% Radio – 5 Hours per week • Classic Rock 38% #1 • Country/Western 33% #2 • Oldies 29% #2 • Current Rock 29% #3 SEGMENT 1: RIBS www.trig-us.com
Other Gaming activities Sweepstakes – 62% #3 Slots – 57% #2 Casino – 53% #3 Raffle – 44% #3 Video Poker – 21% #3 Bingo – 24% #4 Hobbies & Interests 60% 51% 49% 46% 46% 40% 38% 29% 27% 25% 25% 22% 21% SEGMENT 1: RIBS www.trig-us.com
PAST MONTH PLAY: 70% PAST WEEK PLAY: 44% Spend per Month $59 • Largest segment • Want to have fun. GAMES THEY PLAY www.trig-us.com
Values (Sec B) • Truth Trust • Integrity Social Status Colorado Lottery Benefits, Issues & Proceeds (E2,3,4) • Chance to win money (69%) #1 • Keeps money in the state (69%) #1 • Entertainment/fun (59%) #1 • People who can’t afford it play anyway (35%) #2 • People spending money that should go for other things (32%) #1 • State parks (50%) #1 • Roads/highways (44%) #1 Who are they? • Highest average income ($61K) • Least ethnically diverse (87% Caucasian) • Interested in fun and c-store focused What are their thoughts on life? (Sec A) • Believe you have to work for what you get in the world (83%) #3 • It’s important to save as much as possible for retirement (67%) #3 • Like to be entertained (64%) #3 • Like to play competitive games (59%) #2 • Lookout for gifts, treats for others (55%) #2 • Spontaneous person (47%) #2 • Try to fit in with others (34%) #1 • Always looking for the next ‘get rich quick scheme’ (65%) #3 • Can tell when something big is going to happen (20%) #3 • Carefully plan how much discretionary income will go for misc. purchases (16%) #4 SEGMENT 4: FUN FACTS www.trig-us.com
Play - Past MonthYear49%74% 24%44% 43%69% 15%34%14% 27% Average Spend Per PlayPer Month(among players) $4 ($6)$10 ($13) $3 ($6)$5 ($12) $4 ($5)$8 ($12) $2 ($5)$3 ($10) $1 ($5) $3 ($10) SEGMENT 4: FUN FACTS Key Drawing attributes #1 reasons/differentiators Dream of winning big When the jackpot is high Odds of winning • Drawing Game Attitudes (F1) • Realize that in a pool group my portion of the jackpot would probably be much lower than the trigger amount I buy myself (54%) #3 • Use birthdays/ages of family members to pick numbers (26%) #2 • Buy tickets on same day as drawing (18%) #3 • Use hunches to pick my numbers (12%) #2 • Track numbers from previous drawings to help me decide which numbers to pay in future (76%) #4 • For each online game played, buy ticket for every drawing (68%) #4 • Use to play any jackpot amount but now only buy when jackpot it very large (55%) #4 www.trig-us.com
PAST YEAR PLAYERSHIP BY TICKET $ $1$2$3$5$10$20 % play: 55%47%36%45%15% 9% Rank #1#1 #1 #2#4#3 Past Year: 100% Past Month: 70% Past Week: 44% “FAVORITE SCRATCH GAMES” Key Scratch attributes #1 reasons/differentiators Cost of ticket Top prize Previously won on before SEGMENT 4: FUN FACTS Spend per play: $10 Spend per month: $29 • Scratch Game Attitudes (G9) • Would buy a Scratch Game as a gift (100%) #1 • Scratch Games a form of entertainment as well as a chance to win a prize (61%) #2 • Get an adrenaline rush when win a prize (36%) #2 • First thing I notice when I look at a Scratch Game is the theme (34%) #1 • Motivated to buy Scratch Game because of the theme (25%) #2 • Decide which Scratch Games to play before going into the store (54%) #4 • Have a set budget for Scratch Games (47%) #4 www.trig-us.com
“Where do they purchase?” Convenience 83% #1 (71% most often) grocery 46% Liquor 11% “DAYS OF THE WEEK PLAY” % Monday 26% Tuesday 35% Wednesday 52% Thursday 26% Friday 51% Saturday 59% Sunday 24% “DAY Play MOST OFTEN” - % Saturday 32% Friday 24% Wednesday 20% SEGMENT 4: FUN FACTS • Lottery & Gaming Attitudes (C1 & D2) • It is important to me that Lottery proceeds go to a good cause (89%) #2 • Lottery is fun (74%) #2 • Lottery is harmless entertainment (56%) #2 • Like the excitement of betting on games and sports (41%) #2 • I buy Lottery tickets on the spur of the moment (58%) #2 • Playing Lottery games is against my beliefs (93%) #3 • I worry that the Lottery will corrupt our society (76%) #4 • I make my choices to purchase based on the odds (32%) #4 www.trig-us.com
VISIT Colorado Lottery website? 81% Ever #3 35%/58% Past Week/Month 70% (T3B) Excellent website Internet Use per week 12 hours personal 10 hours professional Social Media – 45% use it daily 3.8 Hours Per Week 67% #4 37% #2 33% #3 10% #2 Social Media Product/Brand Promotions 27% interested #2 Media Habits • 82% own a Desktop Computer #1 • 50% own a MP3 Player #2 • 26% play Online games #4 • 58% read a newspaper #3 TV - 16 Hours per week 64% 57% 48% 48% 45% 38% 36% 32% Radio – 5 Hours per week • Country/Western 38% #1 • Classic Rock 37% #2 • Current Rock 32% #1 • Oldies 29% #1 “QUOTE” SEGMENT 4: FUN FACTS www.trig-us.com
Other Gaming activities Sweepstakes – 71% #1 Slots – 65% #1 Casino (In-State) – 62% #1 Raffles – 55% #1 Casino (Out of State) – 35% #2 Cards for money – 31% #1 Hobbies & Interests 51% 51% 49% 46% 43% 40% 35% 29% 26% 25% 24% 24% “QUOTE” SEGMENT 4: FUN FACTS www.trig-us.com
PAST MONTH PLAY:68% PAST WEEK PLAY: 39% Spend per Month $63 • Second largest segment • Most disengaged from Lottery GAMES THEY PLAY www.trig-us.com
Values (Sec B) • Optimism Self respect • IntegrityFamily Relationship Colorado Lottery Benefits, Issues & Proceeds (E2,3,4) • Education (BEST program) (39%) #2 • Helps veterans (15%) #2 • Don’t Know (7%) #1 • Money not going where promised (19%) #1 • Preys on poor people (14%) #1 • Don’t Know (16%) #1 • Veteran’s programs (32%) #2 • Child development programs (32%) #2 • Health Care (33%) #1 Who are they? • Middle of the road in most values • No distinguishing demographics • Most likely to see negatives in lottery and least likely to appreciate benefits What are their thoughts on life? (Sec A) • I am optimistic about the future (57%) #2 • I like taking risks sometimes (35%) #2 • I often buy things I had not intended to purchase (16%) #3 • Always looking for the next ‘get rich quick scheme’ (56%) #2 • Shopping is a fun and entertaining activity (19%) #4 • I make a budget and stick to it (14%) #4 • I am a competitive person (11%) #3 • I like to read advertisements, to find out more about a product (11%) #4 SEGMENT 3: BLAHS www.trig-us.com
Play - Past MonthYear51%76% 30%53% 43%68% 18%34%14% 30% Average Spend Per PlayPer Month(among players) $5 ($7)$13 ($17) $3 ($6)$7 ($13) $4 ($6)$9 ($14) $2 ($6)$4 ($11) $1 ($5) $3 ($11) SEGMENT 3: BLAHS Key Drawing attributes #1 reasons/differentiators Dream of winning big Cost of ticket When the jackpot is high • Drawing Game Attitudes (F1) • I purchase tickets for multiple drawings (13%) #3 • Enjoying playing in a pool because it is a social connection with friends, coworkers and family (58%) #3 • Use hunches to pick lucky numbers (53%) #3 • Enjoy playing in a pool because it gives me more chances to win (54%) #3 • Use birthdays or ages to pick my numbers (44%) #3 • I realize that in a pool group my portion of the jackpot would probably be much lower than than my trigger amount that I buy myself (21%) #4 www.trig-us.com
PAST YEAR PLAYERSHIP BY TICKET $ $1$2$3$5$10$20 % play: 50%41%30%44%19% 9% Rank #3#3#3#4#3#4 Past Year: 100% Past Month: 68% Past Week: 39% “FAVORITE SCRATCH GAMES” Key Scratch attributes #1 reasons/differentiators Cost of ticket Top prize Odds of winning SEGMENT 3: BLAHS Spend per play: $10 Spend per month: $26 • Scratch Game Attitudes (G9) • The more a Scratch ticket costs, the better my chances are of winning (11%) #2 • Have a set budget for Scratch Games (34%) #3 • Motivated to buy Scratch Game because of the theme (28%) #3 • Likely to purchase a ticket with a geographic theme (21%) #4 • Would buy a Scratch Game as a gift (26%) #4 • The prizes on Scratch Games give me the feeling of a “winning experience” (15%) #4 • Prefer Scratch Games with a big top prize (11%) #4 www.trig-us.com
“Where do they purchase?” Convenience 76% #2 (63% most often) grocery 50% Liquor 13% “DAYS OF THE WEEK PLAY” % Monday 28% Tuesday 38% Wednesday 48% Thursday 28% Friday 49% Saturday 55% Sunday 20% “DAY Play MOST OFTEN” - % Saturday 28% Friday 23% Wednesday 16% SEGMENT 3: BLAHS • Lottery & Gaming Attitudes (C1 & D2) • I would rather win cash versus a trip or other non-cash prize (75%) #3 • Most people who win a lot of money in the Lottery end up less happy than they were before (9%) #2 • The Lottery takes advantage of the poor (7%) #2 • I talk to friends or co-workers frequently about the Lottery (53%) #3 • I often buy Lottery tickets as gifts (48%) #4 • Playing the Lottery is the one thing I can do to help my family (44%) #3 • I like playing a game that takes some time to play, rather than one that is over quickly (21%) #4 • Advertisings for the Colorado Lottery games is memorable (14%) #4 www.trig-us.com
VISIT Colorado Lottery website? 84% Ever #2 34%/61% Past Week/Month 65% (T3B) Excellent website Internet Use per week 12 hours personal 9 hours professional Social Media – 49% use it daily 4.5 Hours Per Week 72% #2 32% #3 32% #4 9% #3 Social Media Product/Brand Promotions 20% interested #4 Media Habits • 45% own a Smartphone #2 • 48% own a gaming console #2 • 27% play Online games #2 • 55% read a newspaper #4 TV - 15 Hours per week 62% 49% 42% 42% 41% 29% 28% 27% Radio – 5 Hours per week • Classic Rock 33% #3 • Country/Western 30%#3 • Current Rock 29% #3 • Oldies 26% #3 SEGMENT 3: BLAHS www.trig-us.com
Other Gaming activities Sweepstakes – 66% #3 Slots – 51% #4 Casino (In-State) – 47% #4 Raffles – 41% #4 Casino (Out of State) – 29% #3 Bingo – 27% #2 Hobbies & Interests 52% 48% 44% 43% 39% 33% 29% 28% 27% 25% 23% 22% SEGMENT 3: BLAHS www.trig-us.com