Download
1 / 1

E N D
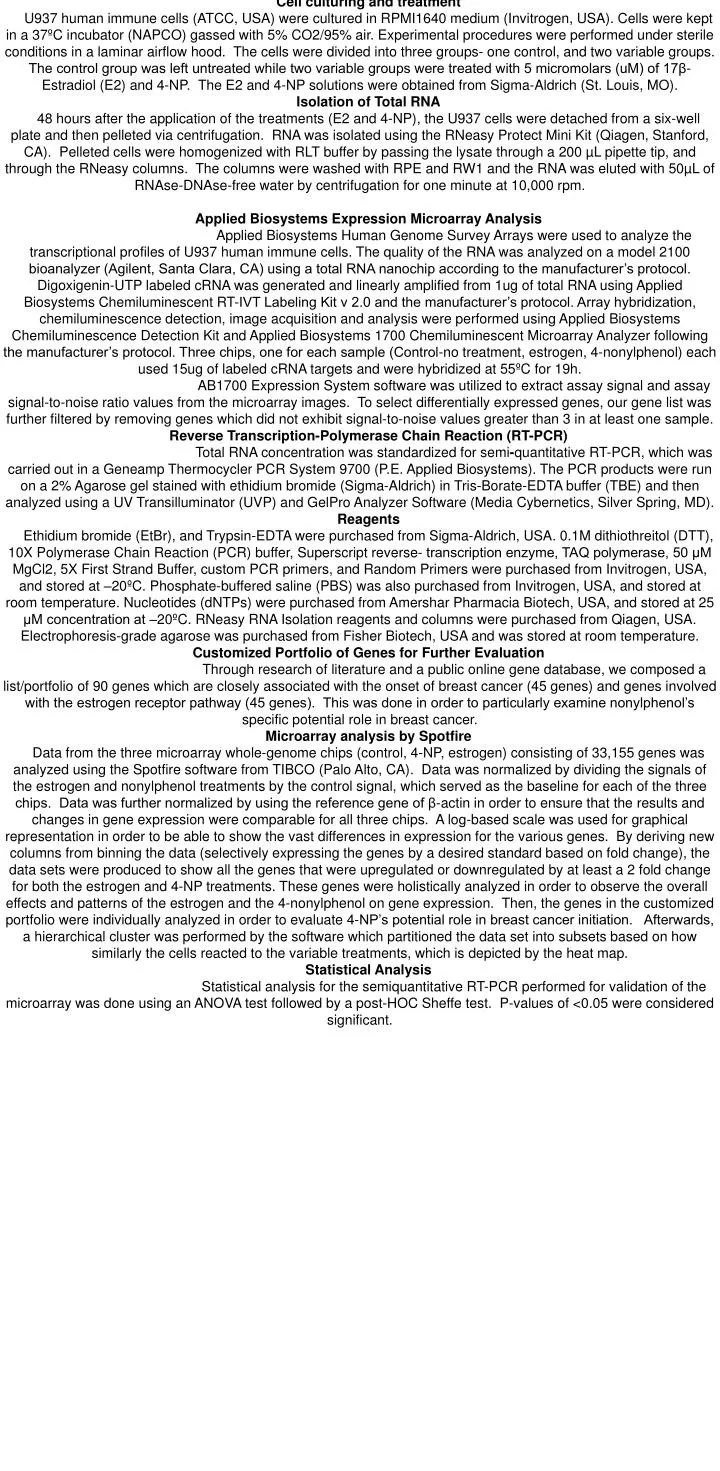
Cell culturing and treatment U937 human immune cells (ATCC, USA) were cultured in RPMI1640 medium (Invitrogen, USA). Cells were kept in a 37ºC incubator (NAPCO) gassed with 5% CO2/95% air. Experimental procedures were performed under sterile conditions in a laminar airflow hood. The cells were divided into three groups- one control, and two variable groups. The control group was left untreated while two variable groups were treated with 5 micromolars (uM) of 17β-Estradiol (E2) and 4-NP. The E2 and 4-NP solutions were obtained from Sigma-Aldrich (St. Louis, MO). Isolation of Total RNA 48 hours after the application of the treatments (E2 and 4-NP), the U937 cells were detached from a six-well plate and then pelleted via centrifugation. RNA was isolated using the RNeasy Protect Mini Kit (Qiagen, Stanford, CA). Pelleted cells were homogenized with RLT buffer by passing the lysate through a 200 µL pipette tip, and through the RNeasy columns. The columns were washed with RPE and RW1 and the RNA was eluted with 50µL of RNAse-DNAse-free water by centrifugation for one minute at 10,000 rpm. Applied Biosystems Expression Microarray Analysis Applied Biosystems Human Genome Survey Arrays were used to analyze the transcriptional profiles of U937 human immune cells. The quality of the RNA was analyzed on a model 2100 bioanalyzer (Agilent, Santa Clara, CA) using a total RNA nanochip according to the manufacturer’s protocol. Digoxigenin-UTP labeled cRNA was generated and linearly amplified from 1ug of total RNA using Applied Biosystems Chemiluminescent RT-IVT Labeling Kit v 2.0 and the manufacturer’s protocol. Array hybridization, chemiluminescence detection, image acquisition and analysis were performed using Applied Biosystems Chemiluminescence Detection Kit and Applied Biosystems 1700 Chemiluminescent Microarray Analyzer following the manufacturer’s protocol. Three chips, one for each sample (Control-no treatment, estrogen, 4-nonylphenol) each used 15ug of labeled cRNA targets and were hybridized at 55ºC for 19h. AB1700 Expression System software was utilized to extract assay signal and assay signal-to-noise ratio values from the microarray images. To select differentially expressed genes, our gene list was further filtered by removing genes which did not exhibit signal-to-noise values greater than 3 in at least one sample. Reverse Transcription-Polymerase Chain Reaction (RT-PCR) Total RNA concentration was standardized for semi-quantitative RT-PCR, which was carried out in a Geneamp Thermocycler PCR System 9700 (P.E. Applied Biosystems). The PCR products were run on a 2% Agarose gel stained with ethidium bromide (Sigma-Aldrich) in Tris-Borate-EDTA buffer (TBE) and then analyzed using a UV Transilluminator (UVP) and GelPro Analyzer Software (Media Cybernetics, Silver Spring, MD). Reagents Ethidium bromide (EtBr), and Trypsin-EDTA were purchased from Sigma-Aldrich, USA. 0.1M dithiothreitol (DTT), 10X Polymerase Chain Reaction (PCR) buffer, Superscript reverse- transcription enzyme, TAQ polymerase, 50 μM MgCl2, 5X First Strand Buffer, custom PCR primers, and Random Primers were purchased from Invitrogen, USA, and stored at –20ºC. Phosphate-buffered saline (PBS) was also purchased from Invitrogen, USA, and stored at room temperature. Nucleotides (dNTPs) were purchased from Amershar Pharmacia Biotech, USA, and stored at 25 μM concentration at –20ºC. RNeasy RNA Isolation reagents and columns were purchased from Qiagen, USA. Electrophoresis-grade agarose was purchased from Fisher Biotech, USA and was stored at room temperature. Customized Portfolio of Genes for Further Evaluation Through research of literature and a public online gene database, we composed a list/portfolio of 90 genes which are closely associated with the onset of breast cancer (45 genes) and genes involved with the estrogen receptor pathway (45 genes). This was done in order to particularly examine nonylphenol’s specific potential role in breast cancer. Microarray analysis by Spotfire Data from the three microarray whole-genome chips (control, 4-NP, estrogen) consisting of 33,155 genes was analyzed using the Spotfire software from TIBCO (Palo Alto, CA). Data was normalized by dividing the signals of the estrogen and nonylphenol treatments by the control signal, which served as the baseline for each of the three chips. Data was further normalized by using the reference gene of β-actin in order to ensure that the results and changes in gene expression were comparable for all three chips. A log-based scale was used for graphical representation in order to be able to show the vast differences in expression for the various genes. By deriving new columns from binning the data (selectively expressing the genes by a desired standard based on fold change), the data sets were produced to show all the genes that were upregulated or downregulated by at least a 2 fold change for both the estrogen and 4-NP treatments. These genes were holistically analyzed in order to observe the overall effects and patterns of the estrogen and the 4-nonylphenol on gene expression. Then, the genes in the customized portfolio were individually analyzed in order to evaluate 4-NP’s potential role in breast cancer initiation. Afterwards, a hierarchical cluster was performed by the software which partitioned the data set into subsets based on how similarly the cells reacted to the variable treatments, which is depicted by the heat map. Statistical Analysis Statistical analysis for the semiquantitative RT-PCR performed for validation of the microarray was done using an ANOVA test followed by a post-HOC Sheffe test. P-values of <0.05 were considered significant.