Download
1 / 25
250 likes | 321 Views
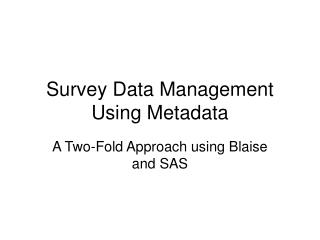
Using Metadata to Link Uncertainty and Data Quality. Richard Wadsworth. Data is a only a representation of a phenomena…. Information not Data Users not Producers What Metadata ought to be doing not what it is doing Exploiting data not discovering data Using land cover as an example.

E N D
Using Metadata to Link Uncertainty and Data Quality Richard Wadsworth
Information not Data Users not Producers What Metadata ought to be doing not what it is doing Exploiting data not discovering data Using land cover as an example Interested in …
“Truth, as in a single, incontrovertible and correct fact, simply does not exist for much geographical information” Real world infinitely complex All representations involve … Abstraction, Aggregation, Simplification etc. Choices about representation depend on Commissioning variation (who “paid” for it?) Observer variation (what did you see?) Institutional variation (why do you see it that way?) Representational variation (how did you record it?) Information v. Reality
Geographic Objects Geographic objects Well defined objects Poorly defined objects Buildings, Roads, … Ambiguous objects Vague objects Non-specific objects Discordant objects Mountains, Sand dunes, … Forests, Bogs, … Rural England, improved grassland …
Two maps (LCMGB, LCM2000), produced 10 years apart, by the same people, using the same basic approach (automatic classification of Landsat ETM+ data) In the OS SK tile (100 x 100km around Leicester) In 1990 <1 ha of “Bog” (12 pixels). In 2000 >7,500 ha of “Bog” (120,728 pixels) Was this global change? (probably not …) An Example …land cover
Network of actors and their links: money information skills control Commissioning context - LCMGB
Network of actors and their links: money information skills control Commissioning context LCM2000
Specific outcome for “Bog” • In 1990 “Bog” was a land cover defined by what could be seen: • “...permanent waterlogging, … depositions of acidic peat … …permanent or temporary standing water … • ...water-logging, perhaps with surface water, …” • In 2000 “Bog” was a ‘priority habitat’ and identification needed ancillary data: • “… in areas with peat >0.5 m deep …” • (no reference to water).
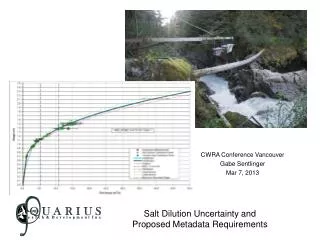
http://home.comcast.net/~gyde/DEFpaper.htm 16 Zimbabwe 14 12 10 Sudan Tree Height (m) 8 Turkey Tanzania Mozambique Morocco Ethiopia FAO -FRA2000 New Zealand 6 Denmark PNG Luxembourg Netherlands SADC Namibia Malaysia Cambodia Belgium UNESCO Jamaica Australia Somalia Japan 4 Israel UnitedStates Gambia Switzerland South Africa Mexico 2 Kyrgyzstan Kenya Portugal Estonia 0 0 10 20 30 40 50 60 70 80 90 Canopy Cover (%) Another example - What is a forest?
So let’s standardise everything? Standards organisations: Want their standard to be adopted Producers: Want to show they can follow a recipe Users: Want reassurance Mediators: Want to show the data to be of merchantable quality
Your car Standards are created (you must have an MOT) Producers ensures their cars conform Mediators (sellers) advertise compliance with the standard User (buyer) is reassured that the car is ok BUT people Buy an AA assessment of a particular car Use “Which Report” (or Jeremy Clarkson?) to understand whether the type of car is Useful not just Useable For data there is no “Which Report” Standards – an analogy
Data Quality Standards • Once dominated by the national mapping agencies and software companies, now dominated by ISO, the Open GIS Consortium etc. • The ‘big 5’ of geo-spatial data quality standards: • Positional Accuracy, • Attribute Accuracy, • Logical Consistency, • Completeness, • Lineage. • Salgé (1995) tried to introduce the concept of semantic accuracy but has largely been ignored.
Uncertainty v. geographic objects *Including: Monte Carlo, bootstrapping, conditional simulations, frequency, confusion matrices etc.
IF you stretch “Metadata” to include: Scientific and policy background (context) Organisational and institutional origins of the conceptualisation (ontology) How were objects measured (epistemology); How were classes specified (semantics); What can be done? Then …
Semantic-Statistical Comparisons One experts opinion of the semantic relationship between classes in two land cover maps. (From “blue” to “red”. “Expected” and “uncertain” relationships)
Assume landscape consists of segments For class A: expected score = 18, uncertain score = 7 (4 class B pixels + 3 class C pixels) unexpected score = 1 (the single pixel of class D).
Segment in second classification For class A: expected score = 19 (class X), uncertain score = 5 (class Z) unexpected score = 2 (class Y).
Combine Scores Scores are treated as if they were probabilities then using Dempster-Shafer: Belief = (Bel1.Bel2 + Unc1.Bel2 + Unc2.Bel1) / β where β = (1 – Bel1.Dis2 – Bel2.Dis1) Bel1 & Bel2 = the beliefs (expected), Unc1 & Unc2 = uncertainties (uncertain), Dis1 & Dis2 = disbeliefs (unexpected). For class A. Bel1 = 18/26 = 0.692, Unc1 = 7/26 = 0.269, Dis1 = 1/26 = 0.038 Bel2 = 19/26 = 0.731, Unc2 = 2/26 = 0.077, Dis2 = 5/26 = 0.192 Therefore: β = 1 – 0.692*0.192 – 0.731*0.038 =0.839 Belief = (0.692*0.731 + 0.693*0.077 + 0.731*0.269) / 0.839 = 0.901 The belief has increased therefore we consider that the segment is consistent for A
Understanding data meaning is increasingly important: Increased number of users Spatial Data Initiatives Decreased role of “old fashioned” but complete metadata (the survey memoirs) Naive belief in technology as a solution (standards, inter-operability etc). Metadata needs to include: - user experience - producers understanding of the data origins of the information expanded Logical Consistency Conclusions