Download
1 / 9
90 likes | 98 Views
Seminar Speech Recognition. Mel-spectrum computation new_fe_sp.c. Presentation by Yu Zhang scuyuzh@hotmail.com Oct 1 st ,2003. Mel-frequency Wrapping.

E N D
Seminar Speech Recognition Mel-spectrum computationnew_fe_sp.c Presentation by Yu Zhang scuyuzh@hotmail.com Oct 1st,2003
Mel-frequencyWrapping We know that human ears, for frequencies lower than 1 kHz, hears tones with a linear scale instead of logarithmic scale for the frequencies higher that 1 kHz. The mel-frequency scale is a linear frequency spacing below 1000 Hz and a logarithmic spacing above 1000 Hz. The voice signals have most of their energy in the low frequencies. It is also very natural to use a mel-spaced filter bank showing the above characteristics.
Mel-frequencyWrapping Use the following approximate formula to compute the mels for a given frequency f in Hz: line 165 of new_fe_sp.cfloat32 fe_mel(float32 x) { return( 2595.0 * ( float32 ) log10 (1.0 + x / 700.0 ) ); } float32 fe_melinv(float32 x) { return( 700.0 * ( ( float32 ) pow (10.0 , x / 2595.0 ) - 1.0 ) ); }
The mel-frequency scale is a linear frequency spacing below 1000 Hz and a logarithmic spacing above 1000 Hz. For each tone with an actual frequency, f, measured in Hz, a subjective pitch is measured on a scale called the ‘mel’ scale. The pitch of a 1 kHz tone, 40 dB above the perceptual hearing threshold, is defined as 1000 mels.
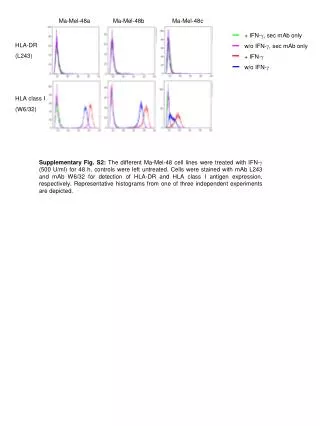
Mel-frequencyWrapping Figure 1 Figure 2 Figure 1: Power Spectrum without Mel-frequency WrappingFigure 2: Mel-frequency Wrapping of Power Spectrum Considering the full image with the mel frequency wrapping set, there is less imformation than the one without the mel frequency.But instead if we looking in details,we see that the image with the mel frequency wrapping keeps the low frequencesand removes some informaiton.To summarize,the Mel Frequency wrapping set allows us to keep only the part of useful information.
= 0,1,…,L-1 Mel spectrum S[k] is the power spectrumN is the length of the Discrete Fourier TransformL is total number ofTriangular Mel weighting filters. The Mel spectrum is computed by multiplying the Power Spectrum by each of the Triangular Mel Weighting filters and integrating the result.
Building the Triangular Mel Weighting filters line 62 in new_fe_sp.cint32 fe_build_melfilters(melfb_t *MEL_FB){ //estimate filter coefficients MEL_FB->filter_coeffs = (float32 **)fe_create_2d(MEL_FB->num_filters, MEL_FB->fft_size, sizeof(float32)); MEL_FB->left_apex = (float32 *) calloc(MEL_FB->num_filters,sizeof(float32)); MEL_FB->width = (int32 *) calloc(MEL_FB->num_filters,sizeof(int32)); filt_edge = (float32 *) calloc(MEL_FB->num_filters+2,sizeof(float32)); … melmax = fe_mel(MEL_FB->upper_filt_freq); melmin = fe_mel(MEL_FB->lower_filt_freq); for (i=0;i<=MEL_FB->num_filters+1; ++i){ filt_edge[i] = fe_melinv(i*dmelbw + melmin); } … for (whichfilt=0;whichfilt<MEL_FB->num_filters; ++whichfilt) { //Building the triangular mel weighting filters … } …}
Building the Mel spectrum line 156 in new_fe_sp.cvoid fe_mel_spec(fe_t *FE, float64 *spec, float64 *mfspec){ int32 whichfilt, start, i; float32 dfreq; dfreq = FE->SAMPLING_RATE/(float32)FE->FFT_SIZE; for (whichfilt = 0; whichfilt<FE->MEL_FB->num_filters; whichfilt++){ start = (int32)(FE->MEL_FB->left_apex[whichfilt]/dfreq) + 1; mfspec[whichfilt] = 0; for (i=0; i< FE->MEL_FB->width[whichfilt]; i++) mfspec[whichfilt] +=FE->MEL_FB->filter_coeffs[whichfilt][i]*spec[start+i]; }} /**FE is the triangular mel weighting filter*spec is the power spectrum*mfspec is the mel spectrumvariables marked in red are coefficients of mel weighting filter*/ l=0,1,…L-1
REFERENCES (1)SPHINX III Signal Processing Front End Specification 31 August 1999, Michael Seltzer (mseltzer@cs.cmu.edu) CMU Speech Group(2) Digital Signal Processing Mini-Project “An Automatic Speaker Recognition System” Minh N. Do, Audio Visual Communications Laboratory Swiss Federal Institute of Technology, Lausanne, Switzerland (3) Project of Digital Signal Processing - AN AUTOMATIC SPEAKER RECOGNITION SYSTEM Swati Rastogi (DSC) swati.rastogi@epfl.ch David Mayor (DSC) david.mayor@epfl.ch