Download
1 / 7
70 likes | 182 Views
The present study was done to investigate the impact of biofield energy treatment on the physicochemical properties of gerbera multiplication medium.

E N D
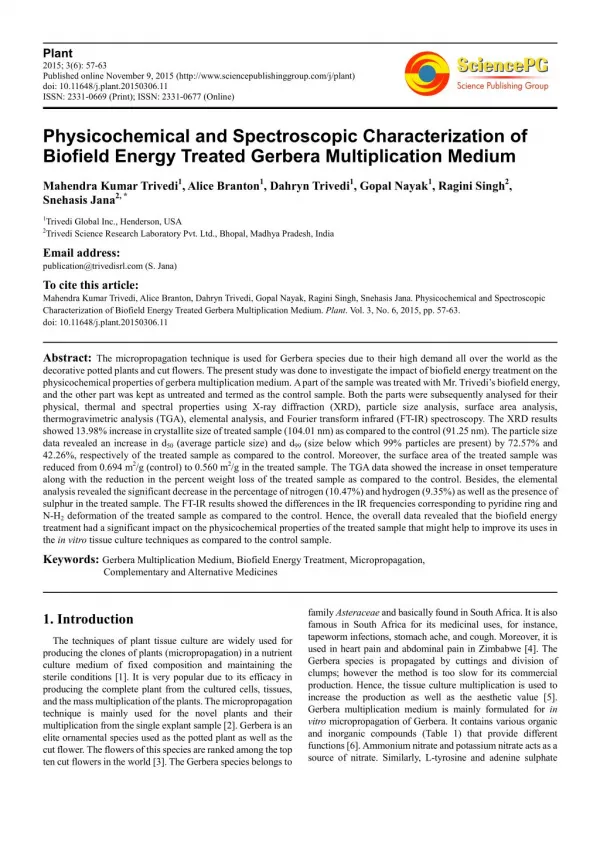
Plant 2015; 3(6): 57-63 Published online November 9, 2015 (http://www.sciencepublishinggroup.com/j/plant) doi: 10.11648/j.plant.20150306.11 ISSN: 2331-0669 (Print); ISSN: 2331-0677 (Online) Physicochemical and Spectroscopic Characterization of Biofield Energy Treated Gerbera Multiplication Medium Mahendra Kumar Trivedi1, Alice Branton1, Dahryn Trivedi1, Gopal Nayak1, Ragini Singh2, Snehasis Jana2, * 1Trivedi Global Inc., Henderson, USA 2Trivedi Science Research Laboratory Pvt. Ltd., Bhopal, Madhya Pradesh, India Email address: publication@trivedisrl.com (S. Jana) To cite this article: Mahendra Kumar Trivedi, Alice Branton, Dahryn Trivedi, Gopal Nayak, Ragini Singh, Snehasis Jana. Physicochemical and Spectroscopic Characterization of Biofield Energy Treated Gerbera Multiplication Medium. Plant. Vol. 3, No. 6, 2015, pp. 57-63. doi: 10.11648/j.plant.20150306.11 Abstract: The micropropagation technique is used for Gerbera species due to their high demand all over the world as the decorative potted plants and cut flowers. The present study was done to investigate the impact of biofield energy treatment on the physicochemical properties of gerbera multiplication medium. A part of the sample was treated with Mr. Trivedi’s biofield energy, and the other part was kept as untreated and termed as the control sample. Both the parts were subsequently analysed for their physical, thermal and spectral properties using X-ray diffraction (XRD), particle size analysis, surface area analysis, thermogravimetric analysis (TGA), elemental analysis, and Fourier transform infrared (FT-IR) spectroscopy. The XRD results showed 13.98% increase in crystallite size of treated sample (104.01 nm) as compared to the control (91.25 nm). The particle size data revealed an increase in d50 (average particle size) and d99 (size below which 99% particles are present) by 72.57% and 42.26%, respectively of the treated sample as compared to the control. Moreover, the surface area of the treated sample was reduced from 0.694 m2/g (control) to 0.560 m2/g in the treated sample. The TGA data showed the increase in onset temperature along with the reduction in the percent weight loss of the treated sample as compared to the control. Besides, the elemental analysis revealed the significant decrease in the percentage of nitrogen (10.47%) and hydrogen (9.35%) as well as the presence of sulphur in the treated sample. The FT-IR results showed the differences in the IR frequencies corresponding to pyridine ring and N-H2 deformation of the treated sample as compared to the control. Hence, the overall data revealed that the biofield energy treatment had a significant impact on the physicochemical properties of the treated sample that might help to improve its uses in the in vitro tissue culture techniques as compared to the control sample. Keywords: Gerbera Multiplication Medium, Biofield Energy Treatment, Micropropagation, Complementary and Alternative Medicines family Asteraceae and basically found in South Africa. It is also famous in South Africa for its medicinal uses, for instance, tapeworm infections, stomach ache, and cough. Moreover, it is used in heart pain and abdominal pain in Zimbabwe [4]. The Gerbera species is propagated by cuttings and division of clumps; however the method is too slow for its commercial production. Hence, the tissue culture multiplication is used to increase the production as well as the aesthetic value [5]. Gerbera multiplication medium is mainly formulated for in vitro micropropagation of Gerbera. It contains various organic and inorganic compounds (Table 1) that provide different functions [6]. Ammonium nitrate and potassium nitrate acts as a source of nitrate. Similarly, L-tyrosine and adenine sulphate 1. Introduction The techniques of plant tissue culture are widely used for producing the clones of plants (micropropagation) in a nutrient culture medium of fixed composition and maintaining the sterile conditions [1]. It is very popular due to its efficacy in producing the complete plant from the cultured cells, tissues, and the mass multiplication of the plants. The micropropagation technique is mainly used for the novel plants and their multiplication from the single explant sample [2]. Gerbera is an elite ornamental species used as the potted plant as well as the cut flower. The flowers of this species are ranked among the top ten cut flowers in the world [3]. The Gerbera species belongs to
58 Mahendra Kumar Trivedi et al.: Physicochemical and Spectroscopic Characterization of Biofield Energy Treated Gerbera Multiplication Medium serves the purpose of amino acid and growth regulator, respectively. Agar acts to provide the firmness to the base where explants are grown [7]. The in vitro culture techniques inhibit the microbial infections on plant cells and ensure the proper development of plants by providing necessary nutrients and environmental conditions. However, the culture media used in these techniques may pose certain issues related to their stability and shelf-life. For example, the gerbera multiplication medium is highly hygroscopic; hence it requires protection from the atmospheric moisture, thus kept in the refrigerator at 2 to 8°C [8]. Therefore, more studies are running in this field to improve the properties of culture media for getting better results [9]. The objective of this study was to search a cost-effective method for altering the properties of gerbera multiplication medium that can help in improving its functions. or non-living object(s) around the Globe. By absorbing this energy, the object responds in a useful way. This process is known as biofield energy treatment. In the present study, the experiments were conducted to analyse the impact of biofield energy treatment on the physicochemical properties of gerbera multiplication medium. The analysis was done using various techniques such as X-ray diffraction, particle size analyser, surface area analyser, thermogravimetric analysis, elemental analysis, and Fourier transform infra-red spectroscopy. 2. Materials and Methods Gerbera multiplication medium was procured from HiMedia Laboratories, India. In treatment methodology, the sample was divided into two parts and named as control and treated. The treated part was handed over to Mr. Trivedi in sealed pack under standard laboratory conditions. Mr. Trivedi provided the treatment to the treated part through his unique energy transmission process, without touching the sample, whereas control part remained as untreated. The biofield treated sample was analysed as compared to the control sample using various analytical techniques. Table 1. Components of the Gerbera multiplication medium. S. No. 1 2 3 4 5 6 7 8 9 10 11 12 13 14 15 16 17 18 19 20 21 22 23 Ingredient Potassium nitrate Ammonium nitrate Calcium chloride.2H2O Magnesium sulphate Potassium phosphate monobasic Sodium phosphate monobasic Manganese sulphate.H2O Boric acid Potassium iodide Molybdic acid (sodium salt).2H2O Zinc sulphate.7H2O Copper sulphate.5H2O Cobalt chloride.6H2O Ferrous sulphate.7H2O Na2-EDTA myo - Inositol Thiamine hydrochloride Pyridoxine hydrochloride Nicotinic acid (Free acid) L-tyrosine Sucrose Adenine sulphate Agar Milligram/Litre 1900.00 1650.00 440.00 180.69 170.00 73.90 16.90 6.20 0.83 0.25 8.60 0.025 0.025 27.80 37.30 100.00 30.00 1.00 10.00 100.00 45000.00 80.00 10000.00 2.1. X-ray Diffraction (XRD) Study The Phillips Holland PW 1710 X-ray diffractometer was used to obtain the X-ray powder diffractograms of the control and treated samples. The X-ray generator was operating at 35kV and 20mA and equipped with a copper anode with nickel filter. The XRD system used 1.54056Å wavelength of radiation. The data was used to calculate the crystallite size (G) using Scherrer equation: G = kλ/(bCosθ) (1) Here, k is constant (0.94), λ is the X-ray wavelength (0.154 nm), b in radians is the full-width at half of the peak and θ is the corresponding Bragg’s angle. 2.2. Particle size Analysis EDTA: Ethylenediamine tetraacetic acid The laser particle size analyzer SYMPATEC HELOS-BF was used for particle size analysis, which was having a detection range of 0.1 µm-875 µm. The percent change in average particle size (d50) was calculated using following equation: The biofield energy treatment is known worldwide for its healing therapies in stress, anxiety and pain related problems [10, 11]. The energy medicines are considered by the National Centre for Complementary and Alternative Medicine (NCCAM)/National Institute of Health (NIH) under complementary and alternative medicines (CAM) [12]. It is based on the putative form of energy that is generated by the human body and present in its surrounding. The living organisms are exchanging this energy from the environment for their health maintenance [13]. The non-living organisms are also reported to possess such energy however up to a limited extent [14]. Mr. Trivedi also possesses a unique biofield energy that is known for its impact on various chemicals [15], microorganisms [16], and plants [17]. His unique biofield energy treatment is also known as The Trivedi Effect®. The biofield energy treatment is harnessing the energy from the environment and transmitting it to any living ?????? ???? ?!"????? #$% ?$&' ????? #$% ?$& × 100 (2) % change in particle size,d??= Here, (d50) Control and (d50) Treated represents the average particle size of control and treated samples, respectively. Similarly, the percent change in d90 and d99 were calculated. 2.3. Surface Area Analysis The Brunauer–Emmett–Teller (BET) surface area analyser, Smart SORB 90 was used to calculate the surface area of the control and treated sample. It has a measuring range of 0.2 m2/g-1000m2/g. The percent change in surface area was calculated using following equation:
Plant 2015; 3(6): 57-63 59 % change in surface area = [S Treated - S Control]/ S Control ×100 (3) wavenumber versus percent transmittance. The obtained spectra of control and treated samples were compared for analysing the impact of biofield energy on the bond length and bond angle of various functional groups present in the medium. Here, S Control and S Treated are the surface area of control and treated samples, respectively. 2.4. Thermogravimetric Analysis/ Derivative Thermogravimetry (TGA/DTG) 3. Results and Discussion The thermal stability profile of gerbera multiplication medium was analysed using Mettler Toledo simultaneous thermogravimetric analyser (TGA/DTG). The temperature range was selected from room temperature to 350ºC with a heating rate of 5ºC/min under air atmosphere. The impact of biofield treatment was analysed by comparing the results of treated sample with that of the control sample. 3.1. X-ray Diffraction (XRD) A series of sharp peaks were observed in the diffractograms of control and treated sample (Fig. 1) in the regions of 10º<2θ>40º. The most intense peak in control sample was observed at 2θ equal to 19.57º; however, in treated sample it was observed at 30.91º. It indicated that the relative intensities of XRD peaks were altered in the treated sample as compared to the control. Besides, the crystallite size of the control sample was found as 91.25 nm whereas; in the treated sample it was found as 104.01 nm. It revealed that crystallite size of the treated sample was significantly increased by 13.98% as compared to the control. The increase in temperature can produce the strain within crystallite that may cause the movement of crystallite boundaries and resulted in the increased crystallite size [18, 19]. Hence, it is assumed that the biofield treatment provided some energy to the sample due to which the crystallite size of treated sample was increased as compared to the control. 2.5. Elemental (CHNSO) Analysis The elemental analyses of control and treated samples of gerbera multiplication medium were done using Model Flash, EA 1112 series CHNSO analyser, Thermo Finnigan (Italy). 2.6. Fourier Transform-Infrared (FT-IR) Spectroscopic Characterization The FT-IR spectra were recorded on Shimadzu’s Fourier transform infrared spectrometer (Japan) in the frequency range 4000-450 cm-1. The spectra were obtained in the form of Fig. 1. XRD diffractograms of control and treated samples of Gerbera multiplication medium. 3.2. Particle Size Analysis 600 524.53 The particle sizes of control and treated samples of gerbera multiplication medium are presented in Fig. 2. It showed that the d50, d90, and d99 were 40.94, 243.05, and 368.72 µm, respectively in the control sample. However, in treated sample, the d50, d90, and d99 were found as 70.65, 356.78, and 524.53 µm, respectively. It revealed that the average particle size (d50) of the treated sample was increased by 72.57%, along with 46.79% and 42.26% increase in the d90 and d99, respectively. It was previously reported that the particle size may be increased due to the impact of temperature [20]. Hence, the resultant increase in particle size in the treated sample might occur due to some energy transfer through the biofield treatment. Generally, the reduction in particle size of such compounds can be correlated to the lower ability to retain water and vice 500 Particle size (µm) 400 356.78 368.72 Control Treated 300 243.05 200 70.65 100 40.94 0 d50 d90 d99 Fig. 2. Particle size analysis of control and treated samples of Gerbera multiplication medium.
60 Mahendra Kumar Trivedi et al.: Physicochemical and Spectroscopic Characterization of Biofield Energy Treated Gerbera Multiplication Medium versa [21]. Hence, the treated gerbera multiplication medium with increased particle size might show improved gelling properties as compared to the control sample. medium that may help in reducing the problem of hygroscopicity as compared to the control sample. 3.4. TGA/DTG Analysis 3.3. Surface Area Analysis The TGA/DTG studies are helpful in analysing the thermal decomposition pattern of the sample during heating. The TGA/DTG thermograms of the control and treated samples of gerbera multiplication medium (Fig. 4) showed the degradation of the samples in two steps. The first step degradation of the control sample, as shown by TGA thermogram was started at 138ºC and ended at 219ºC. However, in the treated sample, the first step commenced at 157ºC and completed at 198ºC. It indicated that the onset temperature of degradation was increased in the treated sample as compared to the control. Moreover, the percent weight loss during the first step of degradation was observed as 18.32% in the control and 8.42% in the treated sample. Besides, DTG thermogram data showed that Tmax was observed at 189.24ºC in the control sample while 182.13ºC in the treated gerbera multiplication medium. The increase in onset temperature of decomposition and reduction in percent weight loss in the treated sample of gerbera multiplication medium suggested the increased thermal stability of the treated sample with respect to the control sample. Moreover, the thermal stability was reported to be directly related to the particle size of the compound [23]. Hence, the possible reason behind the increased thermal stability of the treated sample was the increase in particle size as evident from the particle size data. The increased thermal stability of gerbera multiplication medium after biofield treatment might make its more feasible for the high-temperature treatment (e.g. autoclaving) along with the increase in its shelf-life as compared to the control. 0.8 0.694 0.7 Surface area (m2/g) 0.560 0.6 0.5 0.4 0.3 0.2 0.1 0 Control Treated Fig. 3. Surface area analysis of control and treated samples of Gerbera multiplication medium. The BET method was used to calculate the surface area of control and treated samples of gerbera multiplication medium. The data of control sample (Fig. 3) showed a surface area of 0.694 m2/g; however, the treated sample showed a surface area of 0.560 m2/g. The result showed 19.31% decrease in the surface area of the treated sample as compared to the control. The increased particle size of gerbera multiplication medium after biofield treatment might be a reason for decreased surface area. Besides, it was reported that there is a linear relationship between the adsorption capacity and BET surface area [22]. Hence, the reduced surface area in the treated sample suggests the decreased adsorption capacity of the Fig. 4. TGA/DTG analysis of control and treated samples of Gerbera multiplication medium.
Plant 2015; 3(6): 57-63 61 the control sample. The overall data suggest an alteration in the percentage of elements of gerbera multiplication medium after treatment as compared to the control. 3.5. CHNSO Analysis The percentage of elements present in the given sample was determined using CHNSO analysis. The CHNSO analysis data of control and treated samples are presented in Table 2. The data revealed that the percentage of nitrogen and hydrogen were significantly decreased by 10.47 and 9.35%, respectively in the treated sample. A slight reduction was also observed in the percentage of carbon (0.96%) and oxygen (1.47%) in the treated sample as compared to the control. Besides, the treated sample showed the presence of sulphur that was not detected in Table 2. CHNSO data of Gerbera multiplication medium. Element Nitrogen Carbon Hydrogen Oxygen Sulphur Control 0.86 38.36 6.74 33.99 ND Treated 0.77 37.99 6.11 33.49 0.16 Percent change -10.47 -0.96 -9.35 -1.47 ND: not detected Fig. 5. FT-IR spectra of control and treated samples of Gerbera multiplication medium.
62 Mahendra Kumar Trivedi et al.: Physicochemical and Spectroscopic Characterization of Biofield Energy Treated Gerbera Multiplication Medium 3.6. FT-IR Spectroscopic Analysis and N-H2 deformation of the treated sample as compared to the control. It suggests the impact of biofield energy treatment on the bond strength and dipole moment of the respective groups of compounds present in the treated gerbera multiplication medium. However, further studies are needed for detail analysis of the effect of this treatment on the specific compounds and their impact on the properties of gerbera multiplication medium. The FT-IR spectra of gerbera multiplication medium (control and treated samples) are shown in Fig. 5. The major components of this medium include ammonium nitrate, potassium nitrate, potassium phosphate, disodium EDTA, ferrous sulphate, nicotinic hydrochloride, L-tyrosine, agar, and pyridoxine hydrochloride, etc. Hence, the observed vibration peaks (Table 3) were assigned to the functional groups present in these ingredients. The peak at 3336 cm-1 in the control and treated sample was assigned to N-H stretching of ammonium nitrate, L-tyrosine, and O-H stretching (carboxylic acid) due to nicotinic acid and disodium EDTA [24, 25]; however, the broadness of peak suggested the hydrogen bonding among the compounds. Further, the peaks at 2981 and 2937 cm-1 in the control sample were might be observed due to C-H stretching of disodium EDTA, however, in the treated sample, the peaks were observed at 2979 and 2939 cm-1. The peak at 2819 cm-1 was might occur due to ring stretching of pyridine ring present in nicotinic acid and pyridoxine HCl while the same peak was observed at 2831 cm-1 in the treated sample. Moreover, the peak at 2769 cm-1 in the control sample was not observed in the treated sample. Similarly, the peak at 1633 cm-1 in the control sample was assigned to NH2 deformation that was not observed in the treated sample. Besides, in the control sample the peak appeared as a doublet at 1587 cm-1 was may be due to the ring stretching of the pyridine ring of nicotinic acid and pyridoxine HCl [26]. The peak may also be assigned to the peak due to S-O bond of CuSO4 and P-O bond of KPO4 [25]. Besides, in the treated sample the corresponding peak was observed as a singlet at 1604 cm-1. The peak at 1344 cm-1 in the control and 1348 cm-1 in the treated sample was assigned to the N-H bend and C-N stretching of pyrimidine ring of thiamine HCl and adenine sulphate [26, 27]. Similarly, the peak at 1236 cm-1 in the control and treated sample was assigned to thiazole ring breathing of the thiamine HCl [28]. The peak at 1128 and 1126 cm-1 in the control and treated samples, respectively was may be due to the S-O bond in FeSO4 and ZnSO4, and pyrimidine ring of thiamine HCl. The ring breathing mode of inositol was observed at 997 cm-1 in the control and treated sample. The peak at 914 cm-1 was may be observed due to the Mo=O bond of Na molybdic acid in both control and treated samples [29]. Further, the peak at 860 cm-1 in both, control and treated sample was assigned to B-O bond of boric acid and C-H out of plane bending of thiazole ring in thiamine HCl. The peaks at 684 and 551 cm-1 in the control and 686 and 551 cm-1 in the treated sample were assigned to O-C=O bending of the amino acids present as constituents of the medium. However, the peak might get merged with the N-H out of plane bending peak of adenine sulphate [27]. The ring deformation of inositol ring was observed at 474 and 472 cm-1 in the control and treated sample, respectively. The IR peaks of control sample were assigned according to the reported literature. The data showed the alteration in the IR frequencies corresponding to pyridine ring acid, inositol, thiamine Table 3. Vibration modes observed in Gerbera multiplication medium. Wavenumber (cm-1) Control 3336 2981, 2937 2819 1633 1587 1344 1236 1128 997 S. No. Functional group 1 O-H stretching N-H stretching 2 C-H stretching Compound Nicotinic acid, Disodium EDTA Ammonium nitrate, L-Tyrosine Disodium EDTA, Thiamine HCl, Agar Pyridoxine HCl, Nicotinic acid Treated 3336 2979, 2939 2831 ND 1604 1348 1236 1126 997 3 Pyridine ring 4 5 N-H2 deformation L-Tyrosine Ring stretching (pyridine), P-O stretching N-O stretching N-H bend, C-N stretching Ring breathing (thiazole) Pyrimidine ring stretching S-O bond Ring breathing (carbon ring) Mo=O stretching Na molybdic acid B-O stretching O-C=O bend N-H out of plane Ring deformation Inositol Nicotinic acid, Pyridoxine HCl Potassium phosphate KNO3 Thiamine HCl, Adenine sulphate Thiamine HCl Thiamine HCl, FeSO4, ZnSO4 Inositol 6 7 8 9 10 11 12 914 860 684, 551 472 914 860 686, 551 472 Boric acid L-Tyrosine Adenine sulphate 13 EDTA: Ethylenediamine tetraacetic acid;ND: not detected 4. Conclusions The XRD data, as well as particle size studies, revealed the increase in crystallite size and particle size of the biofield treated sample suggesting the impact of energy provided through the biofield treatment. The surface area data of the treated sample also supports the particle size data and was found to be decreased by 19.31% as compared to the control. These changes might help in increasing the gelling property along with the reduction in hygroscopic nature of the treated medium as compared to the control. The TGA results revealed the increase in onset temperature of degradation and reduction in percent weight loss of the treated sample suggesting the increased thermal stability. Furthermore, the CHNSO analysis revealed the alterations in the percentage of elements (nitrogen, hydrogen, carbon, and oxygen) present in treated sample along with the presence of sulphur as compared to the control. The FT-IR spectra of the treated sample also revealed the changes in IR frequencies corresponding to pyridine ring
Plant 2015; 3(6): 57-63 63 vital energy- scientific bases. Complementary therapies for the contemporary healthcare. InTech. and N-H2 deformation as compared to the control, suggesting the impact of biofield treatment on the bond strength and dipole moment of the corresponding functional group. The overall study revealed the impact of Mr. Trivedi’s biofield treatment on the physical, thermal and spectroscopic properties of the gerbera multiplication medium that could make it more useful and stable as compared to the control. [14]Prakash S, Chowdhury AR, Gupta A (2015) Monitoring the human health by measuring the biofield "aura": An overview. Int J Appl Eng Res 10: 27654-27658. [15]Trivedi MK, Nayak G, Patil S, Tallapragada RM, Mishra R (2015) Influence of biofield treatment on physicochemical properties of hydroxyethyl cellulose and hydroxypropyl cellulose. J Mol Pharm Org Process Res 3: 126. Acknowledgements [16]Trivedi MK, Patil S, Shettigar H, Bairwa K, Jana S (2015) Phenotypic and biotypic characterization of Klebsiella oxytoca: An impact of biofield treatment. J Microb Biochem Technol 7: 202-205. Authors greatly acknowledge the support of Trivedi Science, Trivedi Master Wellness and Trivedi Testimonials in this research work. The authors would also like to thank the whole team from the Sophisticated Analytical Instrument Facility (SAIF), Nagpur and MGV Pharmacy College, Nashik for providing the instrumental facility. [17]Sances F, Flora E, Patil S, Spence A, Shinde V (2013) Impact of biofield treatment on ginseng and organic blueberry yield. Agrivita J Agric Sci 35: 22-29. [18]Hartono A, Satira S, Djamal M, Ramli R, Bahar H, et al. (2013) Effect of mechanical treatment temperature on electrical properties and crystallite size of PVDF Film. AMPC 3: 71-76. References [1]Sathyanarayana BN (2007) Plant tissue culture: Practices and new experimental protocols. I K International Pvt. Ltd., India. [19]Trivedi MK, Nayak G, Tallapragada RM, Patil S, Latiyal O, et al. (2015) Effect of biofield treatment on structural and morphological properties of silicon carbide. J Powder Metall Min 4:132. [2]Prasad MP (2014) In-vitro optimization of growth hormones in the micropropagation of Gerbera species. IJCB 2: 1-5. [20]Lee S, Song D, Kim D, Lee J, Kim S, et al. (2004) Effects of synthesis temperature on photoluminescence characteristics of ZnS: Cu nanocrystals. Mater Lett58: 342-346. [3]Shabanpour K, Sharifi A, Bagheri A, Moshtaghi N (2011) Effect of genotypes and culture medium on shoot regeneration and proliferation of Gerbera jamesonii. Afr J Biotechnol10: 12211-12217. particle size/shape and [21]Van der Kamp JW, Jones J, McCleary B, Topping D (2010) Dietary fibre: New frontiers for food and health. Wageningen Academic Publishers, Netherlands. [4]http://www.plantzafrica.com/plantefg/gerberambig.htm [5]Nhut DT, Thuy An TT, Huong NTD, Don NT, Hai NT, et al. (2006) Effect of genotype, explant size, position, and culture medium on shoot generation of Gerbera jamesonii by receptacle transverse thin cell layer culture. Sci Hortic 111: 146-151. [22]Norman AG (1968) Advances in Agronomy. Academic Press, New York, USA. [23]Sovizi MR, Hajimirsadeghia SS, Naderizadehb B (2009) Effect of particle size on thermal decomposition of nitrocellulose. J Hazard Mater168: 1134-1139. [6]http://himedialabs.com/TD/PT002.pdf [7]George EF, Hall MA, Klerk GJD (2008) The components of plant tissue culture media I: Macro- and micro-nutrients. Plant propagation by tissue culture, 3rdedn, Springer, Berlin, Heidelberg. [24]Lambert JB (1987) Introduction to organic spectroscopy. Macmillan, New York, USA. [25]Miller FA, Wilkins CH (1952) Infrared spectra and characteristic frequencies of inorganic ions: Their use in qualitative analysis. Analytical Chemistry 24: 1253-1294. [8]Reynoird JP, Meynet J, Caissard JC, Chriqui D (1997) Micropropagation of gerbera. Biotechnology in agriculture and forestry: High-tech and micropropagation VI. Springer, Berlin, Heidelberg. [26]Breda S, Reva ID, Lapinski L, Nowak MJ, Fausto R (2006) Infrared spectra of pyrazine, pyrimidine and pyridazine in solid argon. J Mol Struct786: 193-206. [9]Kanwar JK, Kumar S (2008) In vitro propagation of Gerbera- A review. Hortic Sci (Prague), 35: 35-44. [27]Pivovarov VB, Stepanian SG, Reva ID, Sheina GG, Blagoi YP (1995) Infrared spectra and the structure of 1-methyladenine in an argon matrix and solutions. Spectrochim Acta A Mol Biomol Spectrosc51: 843-853. [10]Mager J, Moore D, Bendl D, Wong B, Rachlin K, et al. (2007) Evaluating biofield treatments in a cell culture model of oxidative stress. Explore (NY) 3: 386-390. [28]Rao CNR, Venkataraghavan R (1964) Contribution to the infrared spectra of five-membered N- and N, S-heterocyclic compounds. Can J Chem 42: 43-49. [11]Uchida S, Iha T, Yamaoka K, Nitta K, Sugano H (2012) Effect of biofield therapy in the human brain. J Altern Complement Med 18: 875-879. [29]Stoyanova A, Iordanova R, Mancheva M, Dimitriev Y (2009) Synthesis and structural characterization of MoO3 phases obtained from molybdic acid by addition of HNO3 and H2O2. J Optoelectron Adv M 11: 1127-1131. [12]NIH, National Center for Complementary and Alternative Medicine. CAM Basics. Publication 347. [October 2, 2008]. http://nccam.nih.gov/health/whatiscam/ [13]Saad M, Medeiros RD (2012) Distant healing by the supposed