Download
1 / 51
520 likes | 675 Views
AEP’s gridSMART sm Strategy & Technologies. IEEE Meeting February 24, 2011 Richard Greer. The Evolution of the Electric Utility System. Before Smart Grid: One-way power flow, simple interactions. After Smart Grid: Two-way power flow, multi-stakeholder interactions.

E N D
AEP’s gridSMARTsm Strategy & Technologies IEEE Meeting February 24, 2011 Richard Greer
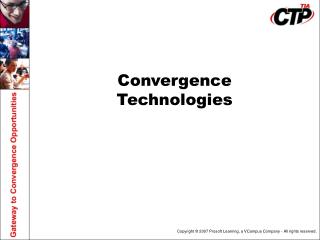
The Evolution of the Electric Utility System BeforeSmart Grid: One-way power flow, simple interactions After Smart Grid: Two-way power flow, multi-stakeholder interactions Adapted from EPRI Presentation by Joe Hughes NIST Standards Workshop April 28, 2008
AEP’s Distribution “Grid Management” Infrastructure • Transforming from Single Source Distribution Circuits to an Interconnected Grid with Multiple Sources, Real Time Visualization, Optimization, Automation, and Control. • Installation of a distribution management system (SCADA) and the development of a distribution energy management system with visualization tools for “multi-source” distribution operations. • Control of voltage and Var to maximize grid efficiency from the generator to the customer • Circuit reconfiguration to improve reliability and optimize circuit performance. • Accommodate and take full advantage of distributed energy sources including renewables, storage, customer generation, and demand response • Installation of remote sensors and automated control devices to provide “real time” analysis of the dispatch of multiple sources on a feeder
Distribution Operations Center (DOC) Distribution Management System DSCADA Outage Management System (OMS) CYBER SECURITY FIREWALL Real Time and Historical Data BACKHAUL COMMUNICATIONS Real Time Distribution Automation Fault Locating AMI Meters Equipment Monitoring and Diagnostics Distributed Energy Resources gridManagement Analytics
Distribution Operations Center (DOC) Distribution Management System DSCADA Outage Management System (OMS) Transformers Line Devices Insulators Conductors Power Up Power Down PING Meter Events Distributed Generation Energy Storage Demand Response Solar & Wind PHEVs CYBER SECURITY FIREWALL Real Time and Historical Data BACKHAUL COMMUNICATIONS Circuit Reconfiguration Device Status Remote Operation Volt Var Control (IVVC) Fault Values Anticipation Indication Real Time Fault Locating Equipment Monitoring and Diagnostics Distribution Automation AMI Meters Distributed Energy Resources gridManagement Analytics
Distribution Operations Center (DOC) Distribution Management System DSCADA Outage Management System (OMS) CYBER SECURITY FIREWALL Real Time and Historical Data BACKHAUL COMMUNICATIONS gridManagement Analytics Real Time Reliability Engineers Demand Response Analytics Distribution Automation Fault Locating AMI Meters Equipment Monitoring and Diagnostics Customer Planning Engineers Operation Engineers Transmission Co-Located Engineers Distribution Market Clearing (future)
AEP gridSMART Deployment Status • Indiana Michigan Power (AEP) – In Service • 10,000 AMI pilot program (GE meters) • Distribution automation • Programmable communicating thermostats • Enhanced time-of-use tariffs • Customer web portal for monitoring & management • AEP Ohio – In Progress • 110,000 AMI deployment in NE Columbus area • Full suite of distribution automation technologies • Advanced technology deployment (Energy storage, PHEVs) • Enhanced time-of-use tariffs • Home area networks & grid-friendly appliances • AEP Texas – In Progress • Approximately 1 million AMI meters • In-home display devices • Tariffs & programs to be offered by REPs
Automated Circuit Reconfiguration • Utilizes communication and intelligent technology to minimize # of customers impacted by an outage • can improve circuit reliability by 30 – 50% • Can improve energy efficiency by notifying operations when a capacitor bank is abnormal • Improves safety and efficiency for field employees by using SCADA for remote switching • This technology has been evolving over several years and standards are being developed. • Actual deployment still is limited in most utilities. • AEP has deployed this technology on less than 2% of circuits. • The potential for improving reliability and increasing energy efficiency of distribution circuits is high if more automation is deployed.
Temporary Fault – Momentary Interruption Station A 900 B R R 300 300 300 900 B R R 300 300 300 Station B 300 900 B R R 300 300
Operational Summary • Traditional Circuit • Temporary Fault – no sustained outage • 600 Customers saw a short interruption (blink) • MAIFI = 1 for these 600 customers
Permanent Fault 600 Customers Outaged Station A 900 B R R 300 300 300 900 B R R 300 300 300 Station B 300 900 B R R 300 300
Operational Summary • Traditional Circuit • Permanent Fault • 1 Instantaneous and 2 time delay trips • 600 Customers Outaged • Circuit SAIFI = 600 / 900 = 0.67 • System SAIFI = 600 / 2,700 = 0.22
Permanent Fault With DA = 300 Customers Outaged Station A 900 B R R 300 300 300 R 900 B R R 300 300 300 Station B 300 900 B R R 300 300
Operational Summary • Circuits With DA • Permanent Fault • 1 Instantaneous and 2 time delay trips • DA Reconfigured Circuits • 600 Customers saw short interruptions (blinks) • 300 Customers Outaged • Circuit SAIFI = 300 / 900 = 0.33 • System SAIFI = 300 / 2,700 = 0.11 • MAIFI for 300 Customers = 1
Transformer Diagnostics & Monitoring • GE Hydran M2: An intelligent, on-line transformer monitoring system that provides: • Per phase real time load, • Per phase winding temperatures, • Transformer top oil temperature, • The level of combustible gases and moisture in dielectric oil, • Oil bubbling temperature, • Aging rate and early detection of incipient faults in station transformers. • 73 units installed • Visible via SCADA and PI Historian
Utility VVC can achieve predictable EE/DR and emission reduction goals AEP’s Volt Var Control Technologies Utility Voltage / Var Control: • Projected benefits of 2% demand and energy reduction are highly predictable because customer consumption is reduced with no action required on their part. • The technology optimizes power factor and voltage levels based on selected parameters • Power factors close to unity minimize losses and relieve transmission congestion • Projected response is a 0.7% demand / energy reduction for each 1% volt reduction • Projected result is 2 - 4% demand and energy reduction • Utilizes communications and computerized intelligence to control voltage regulators and capacitors on the distribution system • Algorithm uses end of line monitoring feedback to ensure minimum required voltage maintained AEP Ohio Demonstration Projects: • Equipment deployment and demonstration of Volt Var Control technologies • GE IVVC – 5 Stations (4 -34KV & 7 - 13KV Circuits) • AdaptiVolt – 1 Station (6 – 13KV Circuits) • Independent analysis by Battelle of theoretical and measured results – Expect savings of MW, MWH, MVAR, and MVARH • Analysis of financial benefits of MW, MWH, MVAR, and MVARH savings • Projections of system wide benefits
Estimated Benefits with GE IVVC on Karl Road 12 kV Feeder Demand Reduction = 88 KVA (2.1%) if voltage reduced 3% KVA Reduction = 325 KVA (8.4%) if pf = 1.0 (4185-3860) Energy Reduction = 52 KW * 8760 = 455 MWH if voltage Reduced 3%
Voltage Range Goals Volts at Residential Meter: • ANSI Standard C 84.1 – 1995 “Electrical Power Systems and Equipment – Voltage Ratings” • [similar to CAN3-C235-83 (R2000)] • Nominal 120 VAC – Range A (Normal Operation) • Service Voltage 114 v – 126 v • Voltage at which utility delivers power to home • Utilization Voltage 110v – 126 v • Voltage at which equipment uses power • Optimum voltage for most motors rated at 115 v • Incandescent Lamps rated at 120 v • Nominal 120 VAC – Range B (Out of Normal Operation) • Service Voltage 110 v – 127 v • Utilization Voltage 106v – 127 v Historical Voltage Range 128 124 “B” Service “A” Service 120 “A” Utilization “B” Utilization 116 112 IVVC Range 108 104 (Adapitvolt estimates)
East Broad – 1406 Geographic Layout REG 1 CAP 2 CAP 1 Substation EOL 55 EOL 57 CAP 3 EOL 56 CAP 4 REG 2
East Broad – 1406 Voltage Profile EOL 55 REG 2 CAP 4 CAP 3 CAP 1 CAP 2 REG 1 Substation
East Broad – 1408 Geographic Layout Substation EOL 64 CAP 1 EOL 63 CAP 2
East Broad – 1408 Voltage Profile EOL 64 Substation EOL 63 CAP 2 CAP 1
Battelle Study – Initial Projections on 8 GE CVVC Circuits Projected Peak Demand Reduction 3% Projected Energy Reduction 3.3%
Volt VAR Control can reduce customer consumption and energy cost 119 Volts 123 Volts 1,034.48 KW 595,448 kwh $42,873 / mo 1,055.6 KW 607,600 kwh $43,740 / mo
Challenges • “Near Real Time Operation” requires highly reliable communication • Vendor solutions for VVC are still evolving • Finding balance point for investment in circuit upgrades vs. control systems • Understanding how technical benefits translate into financial benefits • Determining appropriate regulatory recovery strategy • Communicating that demand and energy reductions are mostly due to reduced consumption and the loss reduction piece is small
AEP’s gridSMART Advanced Technologies Distributed Renewable Generation • 70 KW photovoltaic panels installed on roofs of AEP Service Centers in Newark,OH and Athens,OH [70 KW X 2 = 140KW] • R&D project comparing traditional PV to concentrated PV at AEP’s Dolan Engineering lab (Groveport, OH)
Plug-in Electric Vehicles and Infrastructure Corporate Strategy and Readiness • AEP strongly supports and promotes the adoption of PEV technology • Developing consumer programs (system-wide) which may include “EV-Friendly” rates and incentives. • Working with various stakeholders in all AEP states to ensure greatest consumer experience. • PEV Demonstration – Columbus, Ohio (2010-2013) • Deploying 10 PEVs and 15 charging stations to AEP employees living in the demo area. • Collecting and analyzing driving/charging behaviors and potential impact to grid. Utilizing “smart charging” to reduce impact. • Vehicles will include Chevy Volts, Smart EVs, Ford Escape PHEV, 2 Prius converted to PHEV
AEP’s gridSMART Advanced Technologies Substation Scale Battery • 2006: 1 MW, 7.2 MWh; Deferred substation upgrade in Charleston, WV • 2008: Three installations; 2 MW, 14.4 MWh each;With “islanding” in Bluffton,OH; Balls Gap,WV; East Busco,IN • 2010: 4MW, 25MWh; To be installed in Presidio, TX Community Energy Storage • Small distributed energy storage units connected to the secondary of transformers serving a few houses or commercial loads. • Pursuing development & deployment:
290-360 ºC AEP’s (NaS) Battery Application 1 MW, 7.2 MWh installed in Chemical Station (Charleston, WV - 2006) • Deferred substation upgrades • Three installations in 2008 (2 MW Each) • Peak Shaving • Demonstrate “Islanding” • Storage of intermittent renewables • Sub-transmission support • AEP selected Sodium Sulfur (NaS) technology • Proven technology in Japan (TEPCO) • 1-10 MW, 4-8 hour storage systems • NaS strengths: • Commercial record over 1MW (over 100 installations) • Cost • Compactness • Modularity & Ability to be relocated
- 1.0 MWDischarge 2008 2007 + 1.2 MW Charge AEP 2006 Project – Performance Data 2006 • Scheduled trapezoidal Charge & Discharge profiles • Improved the feeder load factor by 5% (from 75% to 80%) Three Successful Years of Peak Shaving
Community Energy Storage (CES) CES is a small distributed energy storage unit connected to the secondary of transformers serving a few houses or small commercial loads 25 KVA AEP Specifications for CES is “OPEN SOURCE” for Public Use and Feedback. EPRI is hosting free, open webcasts to solicit industry wide input. www.aeptechcenter.com/ces
North AEP Ohio GridSMART Demonstration - CES • CES: 2MW/2MWh; Fleet of 80 25-kW Units • Circuit: Morse Rd 5801; 13 kV, 6.3 MVA Peak Load, 1742 customers • Coverage: Approximately 20% of customers • Schedule: Aug 2010 Test Prototypes Apr 2011 First 0.5MW Oct 2011 Remaining 1.5MW • Status: Jun 2010 – Prototype under construction Morse Rd 5801
Community Energy Storage (CES) CES is a distributed fleet of small energy storage units connected to the secondary of transformers serving a few houses or small commercial loads. STATION CES CES CES CES
CES – Virtual Station Scale Storage CES is Operated as a Fleet offering a Multi-MW, Multi-hour Storage • Local Benefits: • 1) Backup power • 2) Flicker Mitigation • 3) Renewable Integration Substation CES Power Lines Communication and Control Links
Operations Center CES – Virtual Station Scale Storage CES is Operated as a Fleet offering a Multi-MW, Multi-hour Storage • Grid Benefits: • 4) Load Leveling at substation • 5) Power Factor Correction • 6) Ancillary services • Local Benefits: • 1) Backup power • 2) Flicker Mitigation • 3) Renewable Integration CES Control Hub Communication & Control Layout for CES Substation CES CES CES CES Power Lines Communication and Control Links
AMI Head-end CIS (Customer) MDM (Meter) D-SCADA OMS (Outage) History Archives T-SCADA CES Management DWM (Work) GIS (Asset) Regional (Station) VV Controller DA Controller CES Controller D-SCADA RTU T-SCADA RTU Mesh Network (DNP) Feeder Devices Capacitor Regulator Recloser Switch CES Unit Revenue Meter HAN (Zigbee / HomePlug) Customer Devices HVAC Thermostat Water Heater Customer Display PEV Smart Charger CES Control Environment Enterprise Systems Backhaul (Fiber and other)
Circuit Load Leveling Example Circuit Demand
Minimum Demand at for discharge No Discharge on Low demands 2:00 pm Day1 2:00 pm Day2 2:00 pm Day3 Time Triggered Load Following Set Points: • Start Time (same for all days) • Minimum Demand below which no energy should be discharged
Inadequate energy on high-peak days makes peak shaving ineffective Set Trigger Level Load Leveling Challenge – perfect timing
Feeder Load CES # 1 CES # 2 Trigger Level for Charge CES # 3 Trigger Level for Discharge Circuit Feeder's charge and discharge needs are assessed periodically and divided among CES Units on the circuit feeder Evening Morning Noon Midnight Load Leveling – Spread Across the CES Fleet Feeder level demand profile showing CES Unit charge and discharge
CES Energy Allocation during backup • Each customer connected to the CES Unit gets a fair share of available stored energy at the time an outage occurs. • CES goes into backup (island) mode • Establish the island, calculate available energy per locally connected customer; x kWh • Instruct each locally connected meter to initiate energy limiting; allow x kWh • If a customer reaches energy allocation, x kWh, the meter opens its disconnect switch
CES Energy Allocation - Return • CES returns from backup (island) mode when the circuit returns to normal (system is stable for 5 minutes) • CES synchronizes and reconnects to circuit, closed transition • CES cancels energy allocation instruction to each locally connected meter • Each open meter closes the disconnect switch {unless there was another active command to open}
CES Customer Interface Challenges • Another box in the yard, installation • Equipment access for maintenance • Transformer has 4 customers, 2 are interested • Reliability is not really a problem • My neighbor will use all the energy
Transforming to a Smart Grid Engineer • Distribution Engineers will need new skills to plan for stations and circuits utilizing DA, IVVC, DG, and other new technologies. • Planning and protection studies will be more complex • Distribution Engineers will also have access to new data to help analyze system performance and validate the results of studies. • An interesting example is the ability to collect data on the performance of Distributed Generation (DG) and validate the DG’s impact on the system during abnormal conditions. • This type of analysis should lead to higher confidence levels for Distribution Engineers charged with assuring proper operation of their circuits while accommodating and taking advantage of DG in a Smart Grid world
Summary • Customers will see higher reliability and more opportunity to control their energy usage and cost. • Utility employees will have new systems to learn, new responsibilities, and much more information about system operation than they have ever had. • The public at large should see environmental benefits as a Smart Grid helps reduce emissions from generating plants by helping control demand and energy usage while still assuring the customers’ needs for energy are met.