Download
1 / 11
110 likes | 210 Views
Warm-up 3.4 Diagnostic of Influential Points. 4) 5) 6). Student of the day! Block 1. Student of the day! Block 2. 10 minutes. Review the rubric. Make sure you have all graphs and everything labeled appropriately. Make sure all questions are answered in sentences.

E N D
10 minutes • Review the rubric. • Make sure you have all graphs and everything labeled appropriately. • Make sure all questions are answered in sentences. • If your group is ready before the 10 minutes bring up all 3 or 4 of your packets. I will use the random # generator to select one of your packets to represent the group.
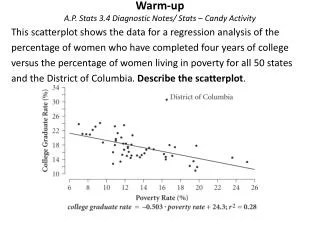
A.P. Stats 3.4 Diagnostics – Looking at Influential Points y-hat = r = **** Plot the points on graph paper first!! Using the original data, enter into L1 and L2. Remove the beaver point (outlier in y) Be sure to go back to the original data including the data for beaverbefore removing the point for hippo. Remove the hippo point (outlier in x) How did removing the beaver affect the data? How did removing the hippo affect the data? y-hat = r = y-hat = r =
A.P. Stats 3.4 Diagnostics – Looking at Influential Points y-hat =10.5 + 1.58x r = 0.769 Using the original data, enter into L1 and L2. Remove the beaver point (outlier in y) Remove the hippo point (outlier in x) How did removing the beaver affect the data? Removing the beaver data increased slope and decreased the y-intercept. The correlation coefficient increased. How did removing the hippo affect the data? Removing the hippo data changes slope and the y-intercept. Correlation increased slightly less than removing beaver. y-hat = 8.14 + 1.69x r =0.828 y-hat = 6.3 + 1.96x r = 0.8
A.P. Stats – D 28 Exploration Sit in groups of 4, where everyone has a graphing calculator. Each person graphs a data set. Describe each graph and write the Y-hat and r. Compare graphs, THEN calculate LineReg L1,L2, Y1 For a. which plot means which data set. Compare the graphs with the scatterplots and the regression line drawn.
Homework 3.4 P#24, 25 and E#43 For P#24, draw a scatter plot with LSRL for c. show the residual plot P#25, do matching for a. b. and answer c. E #43, you are constructing a scatter plot with LSRL again _________________________________________ Next block after 3.5 there will be a notebook check. Bring your textbook because we will begin the textbook review next block after the 3.5 notes. ***We will do an activity that will require 100 pennies or 2 king sized bags of Plain M&Ms. As a table of 3 or 4, decide what you will bring and who will bring what.
Common Quiz mistakes • Interpret the y-intercept and slope means to explain it in context; for example for every inch the women’s height increases the men’s height increases by 1.045. Y-intercept has no meaning in the context of women’s height. For cereal as fat increases by one gram calories increase by 5. A zero fat cereal has 110 calories. • Show that the residuals add up to zero or show that the is on the LSRL. Write out residuals and show the sum is zero or almost.