Download
1 / 36
360 likes | 501 Views
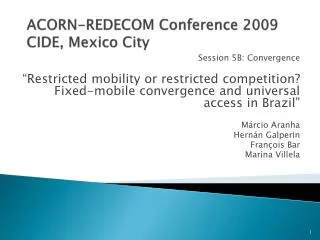
DROUGHT, CLIMATE CHANGE, AND WATER AVAILABILITY Climate and Human Impact Challenges LA SEQU Í A, EL CAMBIO CLIM Á TICO, Y LA DISPONIBILIDAD DE AQUA El Clima y Los Riesgos para Humanidad. Harvey Hill and Jeremy Pittman CHANGE Workshop, Mexico City, Mexico March 5 - 6, 2009.

E N D
DROUGHT, CLIMATE CHANGE, AND WATER AVAILABILITYClimate and Human Impact Challenges LA SEQUÍA, EL CAMBIO CLIMÁTICO, Y LA DISPONIBILIDAD DE AQUAEl Clima y Los Riesgos para Humanidad Harvey Hill and Jeremy Pittman CHANGE Workshop, Mexico City, Mexico March 5 - 6, 2009
http://ct.water.usgs.gov/education/morewater.htm “Water is the best of all things.”(“Agua es la mejor cosa.”) - Pindar (C. 522-C. 438 B.C.), Olympian Odes “When the well is dry, we know the worth of water.” (“Cuando el pozo está seco, sabemos el valor de agua.”) - Benjamin Franklin (1706-1790), Poor Richard’s Almanac, 1746
Finite Freshwater Resources • 97.5% of water on Earth is saline, only 2.5% is fresh water • < 1% of the world's fresh water (~0.007% of all water on earth) is accessible for direct human uses. http://www.globalchange.umich.edu/globalchange2/current/lectures/freshwater_supply/freshwater.html
Freshwater SuppliesEl Suministro de Agua Dulce Average river flows and ground water recharge - 2000 UNEP/GRID-Arendal, 2002
So, What's the problem? • Demand is increasing as the population grows • The water supply is being reduced by pollution and contamination http://www.globalchange.umich.edu/globalchange2/current/lectures/freshwater_supply/freshwater.html Freshwater Demand La Demanda de Agua Dulce Agriculture - 2000
Fresh water will be a critical limiting resource for many regions in the near future. • One-third of the world's population experiences water stress already. • In Asia, per capita availability has declined by 40-60% between 1955 and 1990.
Can we improve use of existing water sources? How can we reduce water scarcity’s impact on the poor? These may well be the 21st century’s most pressing -- Margaret Catley-Carlson, chair, Global Water Partnership
Suggested Role of CHANGEEl Rol Sugerido por CHANGE • Increase resiliency to water stresses • Aumentar la capacidad de recuperación • Through supporting the enhancement of: • Monitoring, Reporting, Forecasting Mitigation, Adaptation, Response and Recovery
The Tough QuestionsLas Preguntas Dificiles • Strategies that seem unconventional today may be necessary to avoid serious constraints in the future – Estrategias que parecaen radicales ahora pueden ser necesarias mañana • Issues are international and are likely to require international solutions – Temas serán internacionales y necesitarán soluciones internacionales • To avoid unintended consequences, policy and decision makers need KNOWLEDGE and INFORMATION – Políticos necesitan CONOCIMIENTO y INFORMACIÓN
Multiple demands for water can lead to competition or collaboration for sustainable development Las demandas por agua pueden crear la competencia o colaboración por desarrollo sostenible M. Clark, Univ. of Col.
If we do what we always have done we might not get where we have always got. Necesitamos nuevas soluciones. Resilient adaptation must account for natural and man made variability
Using information to expand capacity to manage riskUsando Información para el Manejo de Riesgos 50 % Coping ‘ range Probability P (x) Drought Flood x (e.g. moisture) … managing in a variable and changing climate Adapted from concepts by B.Smit Slide Brian Abrahamson Photo courtesy Gilles Belanger
Multi-decadal Droughts are possible – Las sequías prolongadas son una posibilidad real Stahle, D. W., et al. 2000. Tree-ring data document 16th century megadrought over North America. EOS Transactions. Am. Geophy. Union 81(12):121,125.
45 Million 64 Million 2025 2000 Population CLIMAS-U Arizona
Current Collaborative Research, Water Management and Institution Examples Ejemplos de Investigación, Manejo del Aqua, y Instituciones Colaborativos • North American Drought Monitor (NADM)http://www.ncdc.noaa.gov/oa/climate/monitoring/drought/nadm/ • North American Monsoon Experiment (NAME)http://www.eol.ucar.edu/projects/name/ • Commission for Environmental Cooperation (CEC)http://www.cec.org/ • National Integrated Drought Information System (NIDIS)http://www.drought.gov/portal/server.pt/community/drought_gov/202
You have to have WATER
Options that have been Proposed*Algunas Proponidas Opciones • Desalinization of ocean water? • Importing water from the Artic to arid regions? • Commodify water and develop water markets? • Trans-watershed pipelines? • Renegotiate international allocations? • Increase wastewater treatment capacities? • Redirect rivers? *The above are not a part of Canadian Government Policy. The statements above in no way reflect any part of Canadian Water policy
Research OpportunitiesLas Oportunidades para Investigación • Monitoring – e.g. water quantity and quality • Reporting – e.g. consistency and transparency across borders • Forecasting – e.g. ENSO events, PDO, etc. • Mitigation – e.g. stress management strategies that do not stop at the border • Adaptation – e.g. integrated transboundary initiatives • Response – e.g. synergistic activities
Are These Ideal Outcomes of CHANGE?Los Resultados Ideales de CHANGE? • Enhanced transferability of analytical frameworks – Una aumenta en la transferibilidad de los marcos analíticos • Common or translatable technical solutions – Comúnas soluciones técnicas • Common databases – Comúnes bases de datos • Enhance the sharing, and free flow, of data and information – Compartir datos
Possible Outcomes of CHANGELos Resultados Possible de CHANGE • Leverage the CHANGE communities work to Inform Policy and Decision Makers • Function as a portal to current research and NGO initiatives • Identify issues requiring long- and short-term attention • Provision of expert advice from international researchers and practitioners to effectively alleviate short-term stresses • Inform strategic planning to build resilience to long-term stresses
Stepwise VictoriesLas Pequeñas Victorias Establish CHANGE as a functioning and reputable research network Provide broad access to research products developed through CHANGE Members Create linkages with policy and decision makers Facilitate for two-way knowledge flow between CHANGE and government agencies
‘Low Hanging Fruit’Las Victorias Más Faciles • Some form of Project • Transfer of technology
Every few years there’s a drought. When it gets really bad, it suddenly rains politicians, experts and media. Normally the government drifts along at about 8,000 m As soon as the good years return, they evaporate back to 8,000 m They form pools of expertise and funding to cope with the drought cycle
Many Have Adopted a Risk Awareness Vs. Crisis Management Approach http://www.drought.unl.edu/MONITOR/EWS/ch3_Laughlin.pdf
Lake Mead, October, 2004 May take up to 15 years to refill 80 Meters www.independent-media.tv/ gtheme.cfm?ftheme_id=20
Approach to Critical Water Problems • Survey current water problems • Survey current plans and policies for dealing with these problems • Identify water problems and plans likely to be sensitive to climate variability and/or change • Refine spatial and temporal scales of user studies and overall assessment focus After Westcoat (1991). Managing the Indus River Basin in light of climate change: four conceptual approaches. Global Environmental Change, 381-395. • Evaluate the actual and potential effects of climate variability and/or change on selected problems and plans • Refine spatial and temporal scales of user studies and overall assessment focus • Evaluate alternative plans and assess including the use of additional or new climate information • Draw practical conclusion including how and when additional or new climate information might be used
Provide for late Summer/early Fall irrigation while maintaining target flows Next water year runoff unknown, reserve water until February snowpack data Winter season precipitation forecast for Fall release decisions Winter releases based on Jan/Feb snowpack data Winter/Spring forecast for Winter release decisions Peak Flow Augmentation fill curve Summer season forecast for Peak Augmentation planning Week 2 forecasts for Peak Augmentation Peak Flow Augmentation releases Plan releases for Summer irrigation & hydropower Week 2 forecasts for Summer irrigation & hydropower release decisions Provide for Summer irrigation & hydropower needs while maintaining target flows Planning processes Operational issues Climate & weather forecasts Reservoir Management Decision Calendar Water Year Planning Next Water Year Planning Aug Sep Oct Nov Dec Jan Feb Mar Apr May Jun July Aug Sep Oct Andrea J. Ray, Robert S. Webb, John D. Wiener, 2001 Photos: US Bureau of Reclamation, NOAA-CIRES Western Water Assessment
Forecasts in Historical Context Requested by Fire managers… Applicable to any climate variable Recent History | Possible Futures Hartmann
The Methodology Step 1. Problem Identification Step 2. Economic Model Without Impact Step 3. Describe Climatic Variability Step 4. GIS based Hydrologic Model Step 5. Link Hydrology To Impacts On Infrastructure Via GIS Based Tool Step 6. Estimate probability of infrastructure failure Step 7. Run Economic model with extreme events impact Step 8. Identify Viable Resiliency Enhancement Options