Download

1 / 15
150 likes | 234 Views
Multiple Regression Example. David A. Kenny. Previous Webinars. Introduction Advanced Topics. Results. Consider the hypothetical regression equation in which Age (in years) and Gender (1 = Male and –1 = Female) predict weight (in pounds): Weight = 38 + 22(Gender) + 4(Age) + Error.

E N D
Multiple RegressionExample David A. Kenny
Previous Webinars Introduction Advanced Topics
Results Consider the hypothetical regression equation in which Age (in years) and Gender (1 = Male and –1 = Female) predict weight (in pounds): Weight = 38 + 22(Gender) + 4(Age) + Error
Interpretation Weight = 38 + 22(Gender) + 3(Age) + Error intercept: the predicted weight for people who are zero years of age and half way between male and female is 38 pounds; obviously a poor extrapolation gender: a difference between men and women on the gender variable equals 2 and so there is a 44 (2 times 22) pound difference between the two groups age: a difference of one year in age results in a difference of 4 pounds
Other Output Collinearity: Only .031 correlation between Gender and Age; multicollinearity not really an issue. Error Variance: 134.471, sd = 11.60 R2: .912, adjusted R2 = .902
Centering It is advisable to center the Age variable. To center Age, we would subtract the mean age from Age. Doing so, would change the intercept to the predicted score for persons of average age in the study. The average of the sample is 37.1. We subtract 37 from everyone’s age or AgeC and obtain: Weight = 186 + 22(Gender) + 4(AgeC) + Error Note the new intercept equals 38 + (4)(37) or 186. The slope does not change.
Rescaling Gender Note that if we recoded gender to be 1 = Male and 0 = Female, the new equation would be: Weight = 16 + 44(Gender) + 4(Age) + Error intercept: the predicted weight for women who are zero years of age and is 16 poundsgender: men weigh on average 44 more pounds than women, controlling for ageage: a difference of one year in age results in a difference of 4 pounds
Change in Coefficients Note that dummy-coded gender equals 0.5 + (0.5)Gender where Gender is coded +1/-1. Thus, the new intercept is 38 – 22 or 16 new slope for dummy-coded gender is 22/0.5 or 44: Weight = 16 + 44(GenderDC) + 3(Age) + Error
Bilinear Effects Create two variables Age1 (equals age if Age =< 37, 0 otherwise) and Age2 (equals age if Age > 37, 0 otherwise): Weight = 60.223 + 23.349Gender + 3.278Age1 + 3.540Age2 + E The two slopes are not all that different.
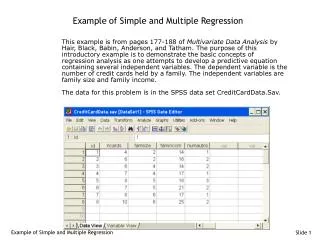
Download Data Syntax Output (All for SPSS 19)