Download
1 / 18
180 likes | 296 Views
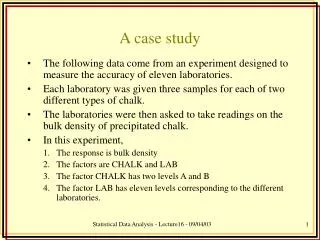
SAPS intensification during substorm recovery: A multi-instrument case study Roman A. Makarevich University of Alaska Fairbanks , USA A. C. Kellerman, J. C. Devlin, H. Ye La Trobe University, Australia L. R. Lyons and Y. Nishimura University of California Los Angeles, USA.

E N D
SAPS intensification during substorm recovery: A multi-instrument case study Roman A. Makarevich University of Alaska Fairbanks, USA A. C. Kellerman, J. C. Devlin, H. Ye La Trobe University, Australia L. R. Lyons and Y. Nishimura University of California Los Angeles, USA
R1 FAC R2 FAC Anderson et al. (1991): Electric Field Recombination Density Conductivity (Current = const) Electric Field … Trough Density Latitude Magnetospheric Current Generator
Southwood and Wolf (1978): V = Ed Charge separation d (Voltage = Ed = const) Electric Field E Magnetospheric Voltage Generator
Timing of Generator Scenarios Objective: investigate timing and causes of major SAPS intensifications
SAPS Event SAID TIG beam 4 UNWbeam 0
SAPS and Substorm Phases Recovery Ground arb units IMAGE UNW SAPS intensification during recovery phase
UNW All Beams UNW all beams UNW keogram
TEC Observations SD FIT GPS TEC SD FIT Vorticity (~FAC)
SAPS and Auroral Precipitation SAPS narrows and separation from precipitation increases
SAPS and TEC Trough Strong 2D association between SAPS and TEC trough
Magnetospheric and Topside Signatures Magnetosphere (LANL, GOES): No parameter was found to exhibit similar time dependence to the SAPS strength during recovery apart from energetic electron fluxes at 01 and 15 MLT (but not at 00 MLT) Topside ionosphere (DMSP IDM): Significant ion upflows Some topside density enhancement
Conclusions • Strong, 2-D association between SAPS and TEC trough was found, but no density decrease during recovery and SAPS intensification • Both voltage and current generator scenarios had difficulties explaining observations • No parameter was found that exhibited similar time dependence to the SAPS intensity, suggesting that it may be triggered, e.g. by convection and auroral bursts
PBI and Convection Burst Some evidence of equatorward motion
SAPS and PBI PBI appears and propagates equatorward