Download
1 / 22
220 likes | 227 Views
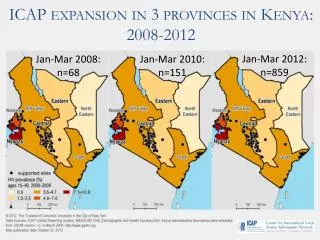
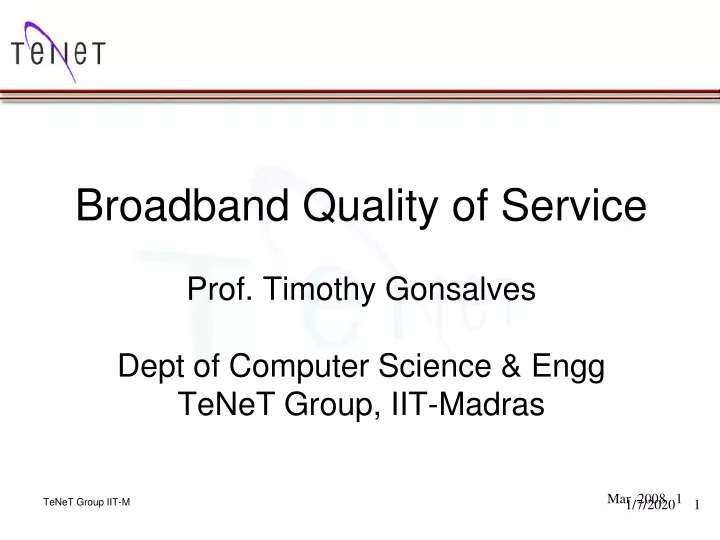
Broadband Quality of Service Prof. Timothy Gonsalves Dept of Computer Science & Engg TeNeT Group, IIT-Madras. Mar 2008. 1. TeNeT Group IIT-M. The users The technologies The QoS metrics The evaluation methodology. Overview. Dense urban areas – 10,000 people/sq. km Sparse rural areas

E N D
Broadband Quality of ServiceProf. Timothy GonsalvesDept of Computer Science & EnggTeNeT Group, IIT-Madras Mar 2008 1 TeNeT Group IIT-M
The users The technologies The QoS metrics The evaluation methodology Overview
Dense urban areas – 10,000 people/sq. km Sparse rural areas Village every 3-10 km Population 1,000-25,000 Within 25 km of fibre 700 m in India ARPU today for 100m subscribers: Rs. 350 ($7) ARPU tomorrow for next billion: Rs. 100 ($2) The Next Billion
ITU-T: 1.5 Mb/s TRAI: 256 kb/s Subscriber: Good experience with common services -- multi-media browsing, downloads, streaming media, VOIP, multi-player gamesRequires 256 kb/s - 1 Mb/s Broadband Defined
ADSL over copper Metro-Ethernet Cable Internet Wireless: urban or rural GSM CDMA DECT WiMAX Broadband Technologies
Aggregation N/w Core N/w ADSL BRAS Aggr Switch DSLAM/ Access Network Dedicated AAA Server Shared ADSL • Downstream 8-24 Mb/s, upstream 0.5-3.5 Mb/s max • Bandwidth guaranteed only to DSLAM, thereafter depends on how operator configures the switches/BRAS/routers • Good for incumbent with many wired subscribers
ISP D1 B2 Metro Core Network Metro Switch Metro Switch Metro Access Network Ethernet UNI Metro Switch D2 B1 Ethernet Access C Customer Edge (Switch/Router) Metro Ethernet Gb/s fibre access with 100 Mb/s CAT-6 in the building Easy provisioning of bandwidth
Cable Internet • Downstream 40 Mb/s shared, upstream 384 kb/s • Requires good quality cable infrastructure
60,000 CATV operators serving 60m homes $2-3/month Cable connection quality good for TV, not good enough for upstream digital Triple-play products from Midas provide 40 Mb/s downstream on poor quality coaxial plant: CITIUS: upstream on wireless corDECT – PC + TV CATIUS: upstream on Ethernet – PC + TV … Cable Internet in India
GSM: GPRS: 56-114 kb/s EDGE: upto 236.8 kb/s HSDPA: Theoretical downlink 14.4 Mb/s Deployed: 7.2 Mb/s Uplink 384 kb/s CDMA: CDMA 1x: 144 kb/s CDMA 3x: downlink 2.4-3.1 Mb/s, uplink 154 kb/s-1.8 Mb/s downlink minimum 38.4 kb/s Wireless
DECT: Broadband corDECT (Midas): 256-512 kb/s dedicated per subscriber WiMAX: 70 Mb/s shared downlink over short distances,10 Mb/s over 10 kms2 Mb/s over long distances … Wireless
Test Methodology Uses multiple tools (BW monitor, ping, tracert) Tests 5 parameters Tests three servers (ISP, National, International) Repeated at different times of the day Repeated at weekdays and weekends Tests for long intervals to minimize effects of short term variations (eg. 100 pings, 100 sec download) Variations studied and outliers removed
Network Diagram of a Test Internet Yahoo 203.208.151.xxx 222.165.130.xxx Network Solutions (USA) 66.163.169.xxx Last mile 220.247.232.xxx Singtel (Singapore) National Server (eg Dialog) SLT User 202.69.200.xxx
Download throughput Upload throughput Round-trip delay (RTT) Delay jitter -- average variation in delay Packet loss Availability of service Broadband QoS Metrics
Relevance of Metrics +++ highly relevant, ++ very relevant, + relevant, - not relevant
Jitter and Round Trip Time • RTT: Time taken for a packet to reach a the destination and return. • Jitter: Variation in RTT M = Average RTT; n=sample size = 100; rk = kth RTT reading • Measured by pinging 100 packets to destination
Packet Loss and Availability Packet Loss = Number of packets (in %) which do not reach the destination (measured by pinging) Availability = 1 – Prob[Service unavailable for >30 sec]
Test tools Download/upload speeds: Measured using BWMonitor while downloading ~ 5 MB file (100 secs)
Test Timings 08:00 hrs: Lean period 11:30 hrs: Peak Business hours 15:00 hrs: Peak business hours 18:00 hrs: Shift from business to residential usage 20:30 hrs: Early residential users 22:30 hrs: Late residential users
Several broadband technologies Wired -- urban Wireless -- urban and rural Tremendous potential for growth Cost of service and QoS are key Six objective measures for QoS Test methodology to minimize bias and error Conclusions
TeNeT Group -- www.tenet.res.in Broadband corDECT, Cable Internet --www.midascomm.com Articles on the various broadband technologies -- http://en.wikipedia.org Broadband QoS study -- http://www.lirneasia.net/projects/current-projects/2241/ Email: tag@tenet.res.in Links