Download
1 / 2
20 likes | 104 Views
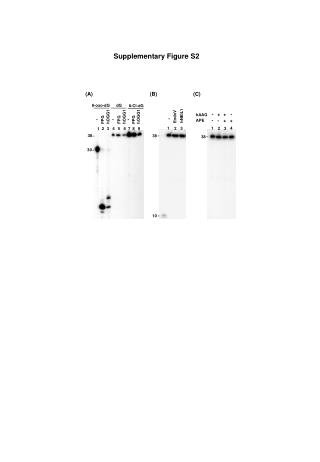
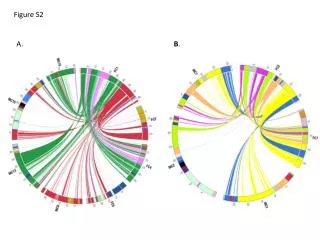
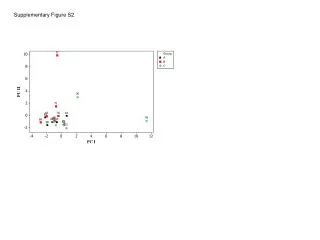
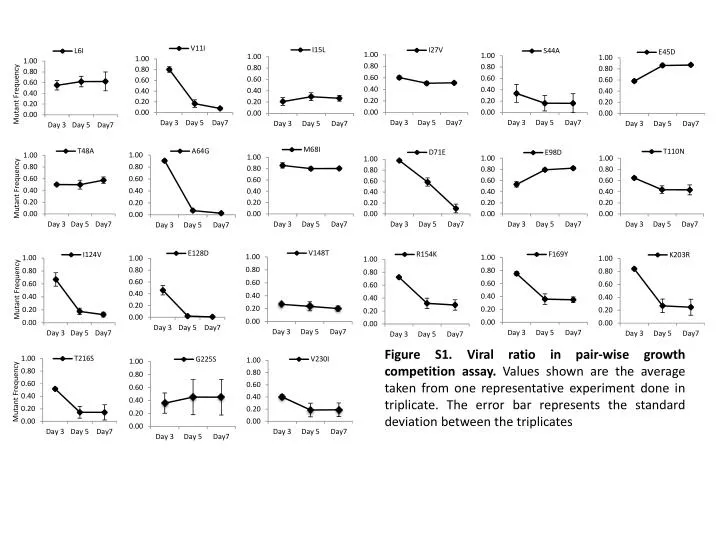
Figure S1. Viral ratio in pair-wise growth competition assay. Values shown are the average taken from one representative experiment done in triplicate. The error bar represents the standard deviation between the triplicates . Figure S2. CA production in transfected 293T culture supernatant.

E N D
Figure S1. Viral ratio in pair-wise growth competition assay. Values shown are the average taken from one representative experiment done in triplicate. The error bar represents the standard deviation between the triplicates
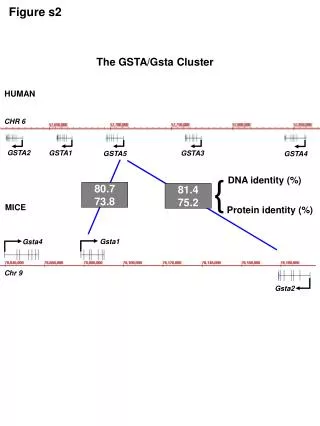
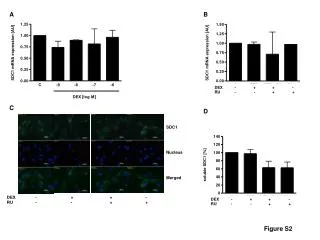
Figure S2. CA production in transfected 293T culture supernatant