Download
1 / 39
590 likes | 1.12k Views
C.D.L.M Govt. Engg. College. The Taguchi Method:. THE SERVICE MANAGER’S PRIMER TO QUALITY Submitted to:- Submitted by:- Mr. Pawan Kamboj Sir Chetan Gosain (Lect. In Mechanical Department ) Roll No:-10512

E N D
C.D.L.M Govt. Engg. College The Taguchi Method: THE SERVICE MANAGER’S PRIMER TO QUALITY Submitted to:- Submitted by:- Mr. Pawan Kamboj Sir Chetan Gosain (Lect. In Mechanical Department) Roll No:-10512 Mech. Branch 4th Year/8th Sem
GENICHI TAGUCHI • Born in Japan, 1924 • Electrical Engineer • Worked during 1950’s to improve Japan’s post-WWII telephone communication system • Father of the “Taguchi Method” and “Robust Engineering”
Topics Covered Dr. Genichi Taguchi The Taguchi Method -Quality Loss Function
The Taguchi method • Quality • Robust Design • Quality Loss Function
Don’t run away! • Not a mathematician? • You can still successfully apply Taguchi Method concepts to your service business. • Basic concepts are simple. • Just keep reading.
Competitive Edge 101: • “In the next century, the capability of developing robust technology will be essential to the competitiveness of any manufacturing enterprise.” (Tsai) (Taguchi: p xi)
Competitive Edge 102: • “To compete successfully in the global marketplace, organizations must have the ability to produce a variety of high-quality, low-cost products that fully satisfy customers’ needs.” (Robust Engineering; p. xiii)
Quality Defined • Ideal Quality - reference point (target value) for determining the quality level of a product or service. - delivery of a product or a service that reliably performs it’s intended use throughout it’s life cycle under reasonable conditions.
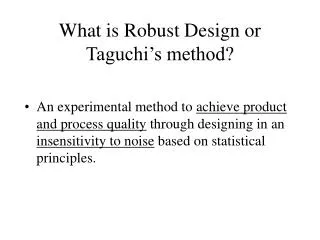
Robust Design • “An Engineering methodology for improving productivity during research and development so that high-quality products can be produced quickly and at low cost” (1). • Products and services designed defect free and of high quality • A design with minimum sensitivity to variations in uncontrollable factors.
Quality Loss Function • Defined • -economical and societal penalties incurred as a result of purchasing a nonconforming product.
DeterminingQuality Loss Function • Specifications are set • Specify a target with minimal variation • Increase in variation cause loss to society
Set Specifications • Loss to society • -Product rejection-Product rework-Pollution
Specify a target with minimal variation • Disagreements with standard quality • LSL- Lower specification limit • USL- Upper specification limit
Specify a target with minimal variation • Quadratic Loss Function
Why use Taguichi’s Quality Loss Function? 1) To find out how much loss is brought to Society due to a purchase of a nonconforming product. 2) To implement a product design improvement.
How can we use Taguchi’s Quality Loss Function in real life? Let’s assume that you are an Operations Manager at a company that produces custom made doors and door frames. During the winter, due to cold weather, doors tend to shrink which lets in cold air through the cracks between the door and the door frame. During the summer doors tend to expand beyond it’s normal size due to hot weather, which makes to door hard to open because it rubs against the door frame. Your job is to produce a door, where dimensions (length and width of the door) are set to a specific target level. In other words in the Winter the door cannot let any cold air in the house and it should open properly in the Summer.
How can we use Taguchi’s Quality Loss Function in real life?
How can we use Taguchi’s Quality Loss Function in real life? The picture shows the same kind of a door under different weather conditions. The way to set a target at a specific level, we must first calculate the dimensions of the door under cold conditions and then during the hot conditions (compared to conditions during the winter and the summer). We then take the most cold temp. and add it to the most hot temp.. We then take the answer and divide it by two to get the average temp. We then place the door under the average temp. to find our set dimensions. These dimensions should be the best solution to a robust design.
Basic Ideas: • CUSTOMER SATISFACTION • Design to the highest standards early in the process to eliminate all non-random errors • Quality Loss = Loss to Society quantified through “Quality Loss Function” • Variation (+/-) from optimal measure results in a loss.
Customer Satisfaction • Ways to measure service: 1. Returning customers 2. Number of complaints (1:10) 3. Number of compliments 4. Employee attitude
Quality Loss Concept • Deviation from target results in loss. • Lower than target • Greater than target • Both lose
Quality Loss Function • Quantify the Loss • Warning: Next slide contains math formulas • But give it a try!
Quality Loss Function II L(y) = k(y-m)2 L(y) = Loss k = constant = cost to correct tolerance2 y = reported value m = mean value (average) (Taguchi On Robust Technology p. 22)
Example: • Company C received an average of 10 complaints per month last year. In November they received 15 complaints (y). Management sets an acceptable level at 2 (tolerance). • It costs the company $50 directly per complaint to correct the problems. They determined the cost in lost sales to be $100. • Total cost per complaint: $150
Example continued: k = $150/22 = $37.50 L(y) = 37.50 (15-10)2 = 37.50 (5)2 = 37.50 (25) = $937.50 is loss for the month of November
Taguchi Experiment – Steps According to Dr. Foster:(OM Review p. 38-44) • Managers’ job: • Identify the Problems • Brainstorm • Contribute to experiment design • Facilitator’s job: • Design experiment • Run experiment • Analyze results • Confirm experiment
Step 1: Problem Identification • What do managers and/or employees see that need improvement?
Step 2:Brainstorming • Identify critical variables in the service that affect quality. • Open and honest discourse with all people involved. • Decide which factors are controllable and which are not.
Step 3: Experiment Design • Using results from brainstorming session, facilitator will design an experiment. • Management must understand this part, and needs to fully support the resources needed for it.
Step 4:Experiment • Use of ANOVA requires managers understand its use. • Facilitator, although in charge of the experiment, must assure management’s understanding of the process.
Step 5:Analysis • Factors closest to target specification identified. • Means to reduce controllable variation produced.
Step 6:Confirm Experiment • Set up new system using data from experiment. • Test and validate results.
Conclusion: • Best improvement is early in the process. • Use expert consulting help for full experiment and implementation. • Successfully used in airlines, insurance, hotels and restaurants. • Quality is a major feature that sets a service apart from the rest.
Success Stories • AT&T Bell Laboratories (Computer Response-Time Optimization). • Chrysler Motors Engineering (Sheet-Molded Compound Process Improvement) • -finished products improved from 77% to 96%. • -scrap was reduced from 16% to 1.7%.
Summary • Companies design and produce low-cost, highly reliable quality products and processes. • Cuts research, development, and delivery time. • Allows engineers to develop flexible technology for the design and production.
Bibliography 1)PRODUCT QUALITY MANAGEMENT BY Frank Moisiadis 2)TAGUCHI APPROACH TO DESIGN OPTIMIZATION FOR QUALITY AND COST Resit Unal & Edwin B. Dean 3) DOE-IBasicDesign of Experiments Presented By Nutek, Inc. 4) Introduction to Taguchi Method Wekipedia.