Download
1 / 23
230 likes | 394 Views
Managing the Underwriting Cycle with Reference to the Energy Market. Market Dynamics. State of the Market Pricing Coverage Reserves Capital Markets Supply Demand Risk Talent Softening. Global Economy GDP Growth Recession Developing markets Sovereign debt Interest rates Inflation

E N D
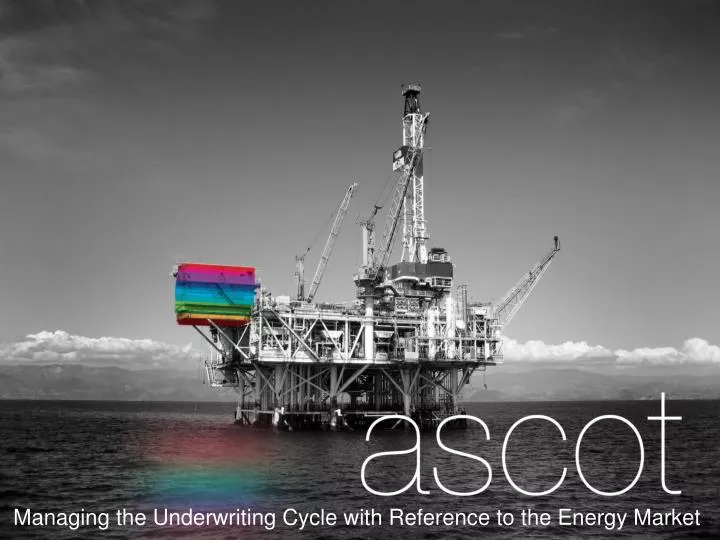
Managing the Underwriting Cycle with Reference to the Energy Market
Market Dynamics • State of the Market • Pricing • Coverage • Reserves • Capital Markets • Supply • Demand • Risk • Talent • Softening • Global Economy • GDP Growth • Recession • Developing markets • Sovereign debt • Interest rates • Inflation • Global economies – emergence of new powers such as China, India & Brazil • Eurozone • Cycle Management Strategies • RoE • Cost of Capital / Excess Capital • Consolidation acquisition • Share repurchase • Dividend strategy • Reserve releases • Combined ratios • Diversification • Value Catastrophe Losses • Recent • Japan • Chile • New Zealand • Australia • USA hail / tornados • Macondo • Thailand • Oil sands • Maersk • Old • WTC • Hurricane Andrew • Asbestos • Hurricanes Katrina, Rita & Wilma • Regulation • Solvency II • China, India & Brazil not open markets to trade in • RMS v11 • Capital models • Recent Californian workers reform package
Global Cycle Management 1983 - 1992 • 1983 Hurricane Alicia and Cat 24 • 1987 ROE’s were in the region of 17.3%* • Significant losses from LMX in the late 1980’s caused huge claims “the spiral” • Significant losses include: • Piper Alpha • Exxon Valdez • Hurricane Hugo • Liability claims on an occurrence form in the back years still deteriorate • Culminated in 1992 with Hurricane Andrew • The market turned on a global basis *Source: Insurance Information Institute
Global Cycle Management 1992 - 2001 • Benign loss period in the early 1990’s • Renewal & restoration at Lloyd’s • Introduction of corporate capital • Global stock market boom / rising interest rates • Introduction of Australian low level reinsurance capacity, e.g. New Cap Re, REAC, G.I.O., Rhine Re, etc. • All started to drive down underwriting discipline culminating in marginal rating going into 2001, which saw significant losses from Petrobras (platform sinking), Sri Lanka (airport attack) & World Trade Center • The market turned on a global basis
Global Cycle Management 2002 - 2005 • From a global hardening at the end of 2001 rates drop off again until Hurricanes Katrina, Rita and Wilma in 2005 • At this point note that even with losses of this magnitude ($100.7bn) this is the first non-global hardening of the market • Territories such as Asia continue to reduce in pricing • Singapore market size by written premium: • 2001: $9bn • 2006: $10bn
Global Cycle Management 2005 - Present • Global rates have been reducing since 2006 with the occasional blip • Hurricane Ike in 2008 • Global financial crisis in 2008 • Withdrawal of circa $80bn of capital in the first half of 2009 is re-injected in July 2009 • Ascot’s rate renewal index for 2009: • 1 January – 30 June: +9.0% • 1 July – 31 December: 0.0% • 2011 had $110bn of claims – with the amount of excess capital only territories with specific losses are hardening, e.g. Japan, New Zealand and Thailand • Earnings event not a capital event • Singapore market size in 2011 was $16bn • Will we ever again see a global hardening from a single event? Source: Aon Benfield
US P&C Total Capital & Surplus • ABA of 31 companies for first half of 2012: $480bn • An increase of $25bn from end of 2011 • Access to capital • Florida March / April 2012: initial estimates were $2bn of reinsurance capital would be required; this was filled within 6 weeks by various sidecars, cat bonds, etc. • Capital models encourage markets to stay within certain classes with poor combined ratios because they offer diversification credit enabling them to write more catastrophe business *Source: Aon Benfield
Lloyd’s Major losses can have a severe impact in a soft market NZ, Japan EQ, Thai Floods: 25.5% WTC Attacks: 26.9% Hurricanes Katrina, Rita, Wilma: 30.8% Overall combined ratio *Courtesy of Lloyd’s, from the 2012 May Market Presentation. Source: Lloyd's Annual Reports. Lloyd’s started to collect prior years’ result movements in 2002, the figures prior to 2002 are Lloyd’s estimates based on prior years’ claims movements.
Global Cycle Management Rate Rises Ascot account
Global Cycle P/C Insurance Industry Combined Ratios 2001 - 2011 As recently as 2001 insurers paid out nearly $1.16 for every $1 in earned premiums Relatively low Cat losses, reserve releases 115.8 Higher Cat losses, shrinking reserve releases, toll of soft market Relatively low Cat losses, reserve releases Average Cat losses, more reserve releases 108.2 107.5 Cyclical deterioration Heavy use of reinsurance lowered net losses 101.0 100.8 100.8 100.1 Best combined ratio since 1949 (87.6) 99.3 98.4 95.7 92.6 * 2009 – 2011 Back year reserve releases stripped out very poor pure accident years *Source: Insurance Information Institute (from A.M. Best, ISO). *Excludes Mortgage & Financial Guaranty insurers 2008 – 2011. Including M&FG, 2008=105.1, 2009=100.7, 2010=102.4, 2011=106.4
Combined Ratios A 100 Combined Ratio isn’t what it once was: Investment impact on ROE’s Combined ratios must be lower in today’s depressed investment environment to generate risk appropriate ROE’s *Source: Insurance Information Institute (from A.M. Best and ISO data). *2008 – 2011 figures are return on average surplus and exclude mortgage and financial guaranty insurers. 2011 combined ratio including M&FG insurers is 108.2, ROAS = 3.5%
Global Cycle Summary Green Shoots of Opportunity • Back year reserve redundancy estimated at $11.7bn • 2011 release estimated at $12.5bn • 2010 release estimated at $12bn • Interest rates (or lack thereof) • Claims inflation • Senior management and shareholders more aware of poor return on capital by underwriting class • What will cause the market to turn? • The points above combined with • External factors such as the Eurozone and low GDP growth in developed countries • A $50bn - $75bn event (Fitch: $50bn - $60bn event) in a country with high pure insurance premium Source: Aon Benfield
Ascot Cycle Management Rationale • Not all doom and gloom: for example Bermuda market stats after Q2 estimate 11.5% ROC • Aon Benfield Aggregate (ABA) group combined ratio is 90.1% for the first half of 2012 • Cycle management critical over the next 2-3 years given market conditions and each company’s cycle management will be driven by its corporate objectives • Ascot • Ascot was incorporated in 2001 • Offices in London, Houston, Chicago, Hartford & Singapore • 2012 GWP $1,075,000,000 • 137 staff worldwide • Aim over 5 years is a 15% return on capital • Over the 10 year cycle Ascot has achieved in the region of 29% return on capital • In our opinion the biggest single contributor towards the underwriting cycle is the supply of capacity against the demand for capacity Source: Aon Benfield
Ascot Cycle Management Tools • Fixed expenses linked to GWP per employee and by underwriting unit • KPI’s that are linked to the return on capital and attritional loss ratios rather than retention rate and GWP • Technical premium for each risk written, benchmarked vs. exit price and the cost of capital for each specific risk written • Pure premium per territory – Chile, New Zealand, Thailand • Even if market increases by 50% is it enough against the aggregate deployed; one of the vagaries of capital models • Rate renewal terms • New business benchmarked vs. current portfolio • All of these require significant investment in Management Information (MI) and quality reporting and give Ascot the ability to flex up and down in classes and sub-classes as the market dictates
Ascot Cycle Management Tools • Aggregate systems that mitigate reliance on models and control tail risk • Collegiate underwriting teams – allowing deployment of aggregate to the class with the best return on capital (GOM wind one of largest clash scenarios) • Strong Risk Committee to review external risk factors, e.g. the global economy, recession (including moral risk), downgrading of corporate bonds, etc. • Lloyd’s • Lloyd’s Franchise Board • Subscription market
Lloyd’s Combined Ratio Track record of strong underwriting performance Combined Ratio Versus Peers *Courtesy of Lloyd’s, from the 2012 May Market Presentation. Sources i) Insurance Information Institute (estimate-2011), ii) Reinsurance Association of America, iii) Company data (8 European companies: 17 Bermudian companies).
E&P Property – Market Update General Energy Losses 1990 – 2011 Excess of $5mn 4 Profitable Years out of 21 …….. “bad risk or over-capacity” *Source: Aon Benfield
Upstream Insurer Capacities 2000 – 2012 (ex GoM windstorm) 2012 upstream capacity highest since records began Operating Construction Estimated “realistic” market capacities • 2012 upstream capacity is the highest since records began • For quality business at realistic prices the market can provide program limits of • $4bn for operating risks • $3.6bn for offshore construction *Source: Willis
Post Hurricane Ike Energy risk losses 2010 accident year to current *Source: Aon Benfield
Year on Year Trend - 2002 (ex Gulf of Mexico windstorm) Reinsurance Product Limit % of NML Attach % of NML First loss attachment point Available reinsurance capacity for *Source: Aon Benfield
Year on Year Trend - 2006 (ex Gulf of Mexico windstorm) GoM Wind Reinsurance Product Reinsurance Product Limit % of NML Limit % of RDS Attach % of NML First loss attachment point Attach % of RDS Reinsurance capacity for Alternative RI “Cat in a Box” *Source: Aon Benfield
Global Cycle Management Ascot Upstream Reinsurance 2002 vs 2006
Year on Year Trend - 2012 (ex Gulf of Mexico windstorm) Reinsurance Product GoM Wind Reinsurance Product Limit % of NML Limit % of RDS Attach % of NML Attach % of RDS *Source: Aon Benfield