Download
1 / 32
320 likes | 620 Views
Objectives. To get familiar with the test procedure to determine the percent crystallinity of plastic packaging materials;To determine the density of polymer samples by the density gradient technique, from which the percent crystallinity of the polymer samples can be estimated;To determine the Tm and percent crystallinity by Differential Scanning Calorimetry..

E N D
1. PKG 829 Packaging Plastics Laboratory Lab 3 Determination of Percent Crystallinity of Polyethylene by the Density Gradient and Differential Scanning Calorimetry
Li Xiong
Fall 2004
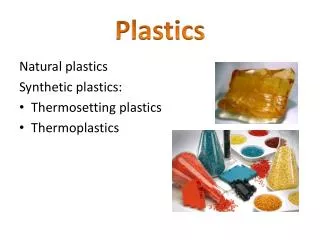
2. Objectives To get familiar with the test procedure to determine the percent crystallinity of plastic packaging materials;
To determine the density of polymer samples by the density gradient technique, from which the percent crystallinity of the polymer samples can be estimated;
To determine the Tm and percent crystallinity by Differential Scanning Calorimetry.
3. Some Background Info. Percent crystallinity
Definition
Also called �degree of crystallinity�, which indicates the relative ratio of crystallinity region and amorphous region in a polymer.
4. It can be expressed either as a volume or a mass ratio.
5. Significance
Many physical, mechanical, thermal and permeability properties of polymer are affected directly or indirectly by the percent crystallinity
Physical: Optical properties, Density, CED (Cohesive Energy Density), Solubility
Mechanical: Impact strength, Tensile strength, MOE (Modulus of Elasticity), Toughness, Stiffness
Thermal: Heat sealing temperature, Specific heat, Heat capacity, Transition temperature (Tg and Tm)
Permeability: Permeability, Diffusion
6. Measurement of percent crystallinity
X-ray scattering (tedious and expensive)
NMR (Nuclear Magnetic Resonance)
Density gradient technique (ASTM D1505-98)
Differential Scanning Calorimetry, DSC (ASTM D3418-99)
7. Testing � Part A Density Gradient Technique Procedure (ASTM D1505-98)
Prepare density gradient (Table 1 in ASTM D1505-98)
Construct the calibration curve with density-known glass beads
Test the specimen and calculate the density
Calculate the percent crystallinity of the test specimen � note it is based on volume
10. Data for density gradient technique
Calibration data for density gradient at 23oC
11. Sinking distance of test specimen at 23oC
12. Testing � Part B Differential Scanning Calorimetry Procedure (ASTM D3148-99)
Prepare sample 3-10 mg
Prepare un-hermetic sealed pan with and without sample
Run DSC
Analyze the DSC curve to get Tm and ?Hf
Calculate the percent crystallinity of the test specimen
13. What is DSC?
is a type of thermal analysis. According to ICTA (International Congress on Thermal Analysis), DSC is defined as �a technique in which the difference in energy inputs into a substance and a reference material is measured as a function of temperature whilst the substance and reference material are subjected to a controlled temperature programme�
V. R. Harwalker and C.Y. Ma, 1990
16. Applications of DSC
Food Research: Protein denaturation, starch gelatinization, fat crystal melting, determine process kinetic and reaction rate
Plastic: Thermal properties, relaxation and transition temperatures
17. Determine Tg
Tg marks the freezing in (on cooling) or the unfreezing (on heating) of torsional oscillations and/or rotational motions of chain segments 20-50 carbon atoms in length in a polymer
The segmental motions take place on the backbone chain bonds as well as in neighboring chains in the case of branched polymers
It indicates the state of the polymer at room temperature
Above Tg, the polymer is in a rubbery state due to the segmental movement of the backbone
Below Tg, the polymer is in a brittle state because it is in the glassy state
18. Determine Tm
Tm marks the transition from solid phase to liquid phase, after which the structural integrity of the polymer is lost
It is only meaningful for crystalline or semi-crystalline polymers because amorphous polymers do not have a melting temperature
In a semi-crystalline polymer, due to the differences in the size and regularity of the individual crystallites, the polymer melts over a temperature range. Tm is then reported as a single value where the melting of the polymer is complete
Tm is important because it represents the minimum temperature for processing of the polymer
19. ?Hf and % crystallinity
?Hf (heat of fusion, cal/g) is the energy involved in the formation or melting of crystalline regions in a polymer
Assume that ?Hf is proportional to the % crystallinity (note it is based on mass), then
20. TA Instruments DSC 2010
Selecting and preparing a sample
Sample size and weight
Pan type and material
Encapsulating the sample in the pan
Loading the sample
Setting up the experimental conditions
Setting up external accessories as required
Starting the experiment
Analyzing the data
22. Sample pan material
Usually use aluminum pan, unless the sample will react with aluminum or the temperature is beyond that allowable for aluminum pans
Sample pans made of platinum, copper, or gold can be used when the transition temperature is in the range of 600~725oC
When alloying or other undesirable metal-sample interactions happen, use graphite pans
23. Sample pan configuration (From TA DSC2010 operator�s manual)
Nonhermtic pans
Hermtic pans
SFI (Solid Fat Index) pans
Open pans
28. Data for DSC
29. Report For �density gradient technique�
Gradient tube information, including identity of solution A and B, and the density range
Calibration curve in the form of table, plot and equation at 23oC
Sample ID and number of specimens tested
Original recorded data (sinking distance), average value and standard deviation
Detailed calculation of density D23C of unknown PE samples
Detailed calculation of % crystallinity of PE samples (both volume- and mass-based)
30. For DSC technique
Sample ID
Description of instrument
Testing conditions
Mass of sample
Rate of temperature change
Description of sample atmosphere (pure gas, flow rate, purity and humidity)
Melting point and heat of fusion
Detailed calculation of % crystallinity (mass-based only)
31. Discussion Comparison of % crystallinity of two PE resins, determined by two techniques. Do the results from two methods agree with each other? (use mass-based values)
Discuss which technique is more accurate
Predict Tg from the DSC result
A detailed discussion of the relation between density and % crystallinity
A discussion of factors affecting % crystallinity
32. 6. Compare the following properties of the two PE resins based on their % crystallinity
Physical
Mechanical
Thermal
Permeability
7. Does the result of % crystallinity of the two PE resins agree with the results from lab 1 (in terms of Izod impact strength)? Be specific and use numbers to demonstrate your point.
33. Questions? Lab report is due by 5pm on Oct 26, 2004
My office hour is 4-5pm on Mondays or by appointment