Download
1 / 25
250 likes | 493 Views
Network Management & Monitoring. Measuring Delay with. Introduction. Based on RRDTool (the same author) Measures ICMP delay and can measure status of services such as HTTP, DNS, SMTP, SSH, LDAP, etc. Define ranges on statistics and generate alarms. Written in Perl for portability

E N D
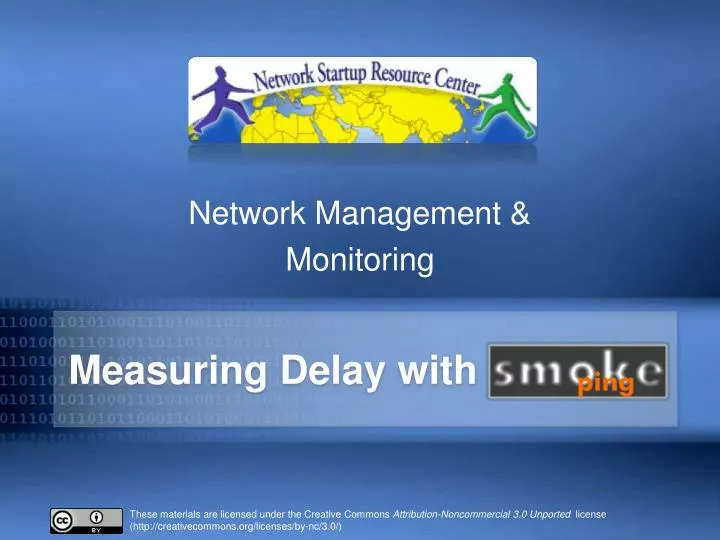
Network Management & Monitoring Measuring Delay with
Introduction • Based on RRDTool (the same author) • Measures ICMP delay and can measure status of services such as HTTP, DNS, SMTP, SSH, LDAP, etc. • Define ranges on statistics and generate alarms. • Written in Perl for portability • Easy to install harder to configure.
Introduction: “Marketing” • SmokePing keeps track of your network latency: • Best of breed latency visualisation. • Interactive graph explorer. • Wide range of latency measurment plugins. • Master/Slave System for distributed measurement. • Highly configurable alerting system. • Live Latency Charts with the most 'interesting' graphs. • Free and OpenSource Software written in Perl written by Tobi Oetiker, the creator of MRTG and RRDtool
How to Read Smokeping Graphs How to Read Smokeping Graphs • Smokeping sends multiples tests (pings), makes note of RTT, orders these and selects the median. • The different values of RTT are shown graphically as lighter and darker shades of grey (the “smoke”). This conveys the idea of variable round trip times or jitter. • The number of lost packets (if any) changes the color of the horizontal line across the graph.
What makes it tick! The following packages are needed or recommended: • rrdtoolhttp://oss.oetiker.ch/rrdtool/ • fpinghttp://www.fping.com/ • echopinghttp://echoping.sourceforge.net/ • speedyCGIhttp://www.daemoninc.com/SpeedyCGI/ • Apachehttp://httpd.apache.org/ • Perlhttp://www.perl.org/
Smokeping: Installation Debian/Ubuntu: • apt-get install smokeping • Configure /etc/smokeping/config.d/* • Change Smokeping's appearance here: • /etc/smokeping/basepage.html • Restart the service: • /etc/init.d/smokeping restart • /etc/init.d/smokeping reload • service smokeping restart/reload
Smokeping Installation You will find Smokeping running here: http://pcN.ws.nsrc.org/cgi-bin/smokeping.cgi
Configuration Smokeping configuration files in Ubuntu 10.04 include: /etc/smokeping/config.d/Alerts /etc/smokeping/config.d/Database /etc/smokeping/config.d/General /etc/smokeping/config.d/pathnames /etc/smokeping/config.d/Presentation /etc/smokeping/config.d/Probes /etc/smokeping/config.d/Slaves /etc/smokeping/config.d/Targets Generally we spend most of our time in Alerts,General, Probes and Targets.
Configuration: General Update: • owner NOC • contact sysadm@localhost • cgiurl http://localhost/cgi-bin/smokeping.cgi • mailhost localhost • syslogfacility local5 *** General *** @include /etc/smokeping/config.d/pathnames # Please edit this to suit your installation owner = NOC contact = sysadm@localhost cgiurl = http://localhost/cgi-bin/smokeping.cgi mailhost = localhost # specify this to get syslog logging syslogfacility = local5 # each probe is now run in its own process # disable this to revert to the old behaviour # concurrentprobes = no
Configuration: pathnames Normally you should not need to update this file: sendmail = /usr/sbin/sendmail imgcache = /var/www/smokeping imgurl = ../smokeping datadir = /var/lib/smokeping dyndir = /var/lib/smokeping/__cgi piddir = /var/run/smokeping smokemail = /etc/smokeping/smokemail tmail = /etc/smokeping/tmail precreateperms = 2775
Configuration: Presentation • If you wish to customize Smokeping’s look and feel you can edit the file /etc/smokeping/basepage.html • To change how Smokeping presents graphs you can edit this file. *** Presentation *** template = /etc/smokeping/basepage.html + charts menu = Charts title = The most interesting destinations ++ stddev sorter = StdDev(entries=>4) title = Top Standard Deviation menu = Std Deviation format = Standard Deviation %f ++ max sorter = Max(entries=>5) title = Top Max Roundtrip Time menu = by Max format = Max Roundtrip Time %f seconds File continues…
Configuration: Alerts • Very flexible. Create your own type of alert. • Send alerts to ticket queues (RT using rt-mailgate, for instance) • Somewhat complex to understand. Read the Alerts section of the Smokeping on-line configuration documentation:http://oss.oetiker.ch/smokeping/doc/smokeping_config.en.html *** Alerts *** to = net@localhost from = smokeping-alert@localhost +bigloss type = loss # in percent pattern = ==0%,==0%,==0%,==0%,>0%,>0%,>0% comment = suddenly there is packet loss +someloss type = loss # in percent pattern = >0%,*12*,>0%,*12*,>0% comment = loss 3 times in a row over 12 samples Remember this goes to our RT queue. Ubuntu-specific alert. The name is misleading as the alert is for any loss when there was none previously.
Configuration: Database • Defines how RRDtool will save data over time in Round Robin Archives (RRAs) • By default each step is 300 seconds (5 minutes). • You cannot trivially change the step setting once data has been collected. • Details on each column in the Database section of the Smokeping on-line • configuration documentation:http://oss.oetiker.ch/smokeping/doc/smokeping_config.en.html *** Database *** step = 300 pings = 20 # consfn mrhb steps total AVERAGE 0.5 1 1008 AVERAGE 0.5 12 4320 MIN 0.5 12 4320 MAX 0.5 12 4320 AVERAGE 0.5 144 720 MAX 0.5 144 720 MIN 0.5 144 720 consfn: Consolidation function mrhb: Percent of consolidated steps that must be known to warrant an entry. steps: How many steps to consolidate for each entry in the RRA. total: Total number of rows to keep in the RRA. Use rows and steps to determine time data will be saved. 12 steps = 12 x 300 sec = 1 hour 4320 rows = 4320 hours = 180 days
Configuration: Probes Smokeping is installed with a number of additional probes. They must, however, be specified here – including their default behaviors. *** Probes *** + FPing binary = /usr/sbin/fping + DNS binary = /usr/bin/dig lookup = nsrc.org pings = 5 step = 180 + EchoPingHttp binary = /usr/bin/echoping ignore_cache = yes pings = 5 url = / + EchoPingHttps binary = /usr/bin/echoping pings = 5 url = / + EchoPingSmtp binary = /usr/bin/echoping forks = 5 Use the DNS probe to verify that your services are available and responding as expected. We use ”nsrc.org” as a sample hostname to lookup, to verify that the DNS works.
Configuration: Slaves Smokeping slave servers allow for multi-viewpoint monitoring and graphing of the same services, machines or links. Details here:http://oss.oetiker.ch/smokeping/doc/smokeping_master_slave.en.html # *** Slaves *** # ## make sure this is not world-readable! ## secrets=/etc/smokeping/slave-secrets # # +slave1 # display_name=slave_name # color=0000ff That is, you can externally monitor your network!
Configuration: Targets *** Targets *** probe = FPing menu = Top title = Network Latency Grapher + UO menu = University of Oregon title = UO webserver host = www.uoregon.edu + NSRC menu = NSRC title = Network Startup Resource Center host = www.nsrc.org ++ HTTP menu = HTTP probe = EchoPingHttp +++ www menu = NSRC web host = www.nsrc.org ++ DNS menu = DNS probe = DNS +++ dns menu = NSRC DNS host = www.nsrc.org • Where we spend most of our time configuring Smokeping. • Web menu hierarchy defined by “+”, “++”, etc. • Each new probe statement resets the default probe in use. • Probes have defaults set in the Probes config file. These can be overridden in Targets.
Default Probe: FPing • Probing for delay and jitter (ping) • Performance and availability probe of a server. • Entry belongs in the Targets file: Latency +++ LocalMachine menu = localhost title = Our local machine host = localhost alerts = startloss,someloss,bigloss,rttdetect
Probe: DNS Check DNS Latency ++ DNS probe = DNS menu = External DNS Check title = DNS Latency +++ nsrc host = nsrc.org In /etc/smokeping/config.d/Targets:
MultiHost Graphing Solve the issue of multiple hosts, one probe and missing differences in the Y axis (time):http://oss.oetiker.ch/smokeping/doc/smokeping_examples.en.html Sample configuration +++MultihostRouters menu = MutihostRouters title = Combined Router Results host = /Local/Routers/gw-rtr /Local/Routers/rtr1 /Local/Routers/rtr2
More Types of Probes More information available here:http://oss.oetiker.ch/smokeping/probe/index.en.html A few more probes... • DNS - CiscoRTTMonDNS - Radius • HTTP(S) - CiscoRTTMonTcpCon - IOS • LDAP - Tacacs - FPing6 • Whois - WebProxyFilter - Etc. • SMTP - WWW-Cache
Summary • Simple but powerful network monitoring • Monitor machines, services and link health • Distributed instances for external views – often a paid-for service • Easy to configure and customize, but very extensible. • Can use with Ticketing Systems to automate alerts • Very small disk and CPU footprint
References Smokeping website: http://oss.oetiker.ch/smokeping/ Smokeping Demo: http://oss.oetiker.ch/smokeping-demo/?target=Customers.OP Good examples:http://oss.oetiker.ch/smokeping/doc/smokeping_examples.en.html