Download
1 / 11
110 likes | 239 Views
Exponential changes. In this section we will learn: Some common examples of exponential changes. What an exponential change signifies. Two useful ways of testing for exponential curves. Let’s start with a bit of British history………. The Black Death of 1666.

E N D
In this section we will learn: • Some common examples of exponential changes. • What an exponential change signifies. • Two useful ways of testing for exponential curves.
Let’s start with a bit of British history………. The Black Death of 1666
Plot a graph of Plague deaths (y axis) against Week number (or time) on the x axis. Now plot a graph of logof plague deaths against time. You’ll notice that parts of the graph are a straight line. These are the periods when the plague deaths grew EXPONENTIALLY with time. There are lots of examples of exponential growth (and decay) all around us.
Radioactive decay. • Bacterial growth which turns milk into yoghurt. • Epidemics. • Many chemical reactions. • Oscillations of a bridge.
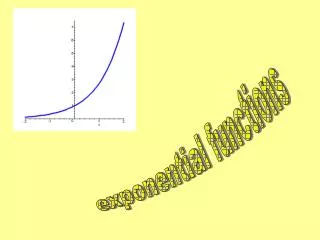
What is an EXPONENTIAL CHANGE? An exponential curve grows (or decays) so that the amount present is MULTIPLIED by the same FACTOR in successive time intervals. We’ve met this idea already, in RADIOACTIVE DECAY. When a radioactive material decays, the amount of material goes down by the same factor (a half) in successive time intervals.
Count rate reduces by ½ for every time interval t (about 15 hours in this case) t We give t a special name – “half-life” – to show that the quantity is halved after this time interval.
TESTS for exponentiality. How can you tell if your growth or decay is exponential? • The RATIO test. • Pick several equal time intervals and read off the quantities from the data or graph. • Work out the ratio of each quantity to the next. If it’s the same, your change is exponential. Ratios: 720/1094 = 0.66 1094/1663 = 0.66 1663/2528 = 0.66
2.The log graph test. Re-plot your graph but this time use the logarithms (log10 or loge – called ln on your calculator) of your quantities against time. If your graph is a straight line, you have an exponential relationship. It takes a little more time to do this test. It’s very useful to plot a log test graph for any coursework that you do. Not only will you find an exponential relationship, but you can use the straight line y = mx + c to come up with a maths relationship from the graph.