Download
1 / 45
460 likes | 728 Views
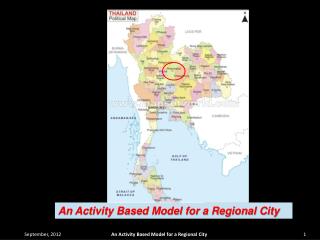
A 3-regional CGE-model for China. Development Research Centre, PRC. Presentation Outline. Introduction Economic part of the three-regional model Environmental part of the three-regional model Further Analysis. Introduction. The main goal:

E N D
A 3-regional CGE-model for China Development Research Centre, PRC
Presentation Outline • Introduction • Economic part of the three-regional model • Environmental part of the three-regional model • Further Analysis
Introduction • The main goal: To analyze environmental implications of China’s WTO accession • Geographic differentiation: A single China-wide model A two regional model (GD-Guangdong and ROC-Rest of China) A multi-regional model
The three-regional model • The three -region Chinese CGE model we employ in this study is an extension of the following models that had been used in China’s WTO accession study • the single region Chinese CGE model (Development Research Center, 1998) • The two regional Chinese CGE model (Li and Zhai, 2000,2002) • Three regions • GD (Guangdong), SX (Shanxi) and Rest of China (ROC) • Why?
Introduce of the geographic differentiation into the model - to reflect the different impact on different regions of WTO accession in China according to different regional comparative advantage, etc.
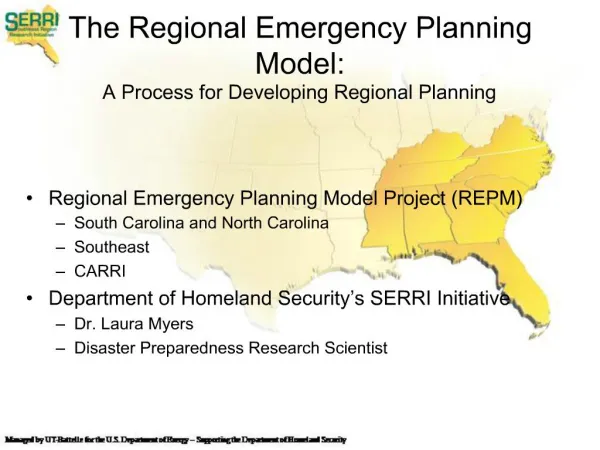
Shanxi Province Guangdong Province
The differentiation between GD and SX • Location, Area • Population • Nature Resource • Economic development • GDP, Per capita GDP, Market openness, Industrial structure, International trade, etc. • Infrastructure, FDI, Human resource, Institutions, etc. • ……
Average Low High GDP growth High Average Per capita GDP Low
Guangdong Province • Guangdong province locates in southern China, neighboring Hong Kong and Macao. As one of the largest economies in China, • It accounts for 35 percent of national foreign trade in 2003. • The development of Guangdong since 1978 and its economic structure could be a representation of China’s coastal area.
Shanxi Province • Shanxi, locates on the middle part of North China. • As the "Coal Warehouse of China", the output of coal in Shanxi ranks the first in China and accounts for nearly one-fourth of the country's total. • According to the UNIDO technique classification, resource-based manufactured export account for 61.94% of the total manufactured export in 2000.
Difference between 2 regional model and 3 regional model - “bilateral” to “triangular” , etc. • Some important issues in the model - data - environmental issues - “new” energy
Economic part of the three-regional model • Data-three regional SAM • CGE-Model
Data-three regional SAM • Inter-regional trade • Two separate trade regimes • Different household groups
Inter-regional trade • In most countries, interregional trade is not covered by official statistics, which results in it having to be estimated by whoever has an interest in it (Pedro Ramos et al., 2003). In China, that is the case, too. • With regional IO tables and Customs Statistics, we can get international trade, inflow (not incl. import) and outflow (not incl. export)
Inter-regional trade • The main method used to estimate the inter-regional trade in this study Indirect Estimation--Use of Gravitational model • We only estimation the inter-regional trade Matrix (3×3) for merchandise trade. • For services trade we use the net outflow.
Gravity model Where, suffix i refers to the origin, j refers to the destination. Dj is the total demand for a given commodity in region j; Si is the total supply in region i; TDS is the total demand (or total supply) for the three regions. GDP is the regional economic size (share of GDP). OI is the trade openness index. d is the distance between the region i and j. α,β ,γ andδ are parameters.
first step :To choose the parameters, we structure the following programming problem :
Second step :To balance the trade matrix, we use Cross Entropy Methods:
(Continued) • The statistic transportation yearbook provide the inter-regional transport data for coal. • The correlation coefficient between the published trade matrix and estimated trade matrix is 0.82.
Two separate trading regimes • Two separate trading regimes Processing trade Ordinary trade • In this SAM, both production and trade are divided between ordinary trade and processing trade.
Different household groups • In the SAM, all households are divided into 14 groups, 7 groups of urban households and 7 groups of rural households.
CGE-Model • Model Dimension • Production and Factor Markets • Interregional and Foreign Trade • Income Distribution and Demands • Central and Regional Governments, and Extra-budget Public Sector • Macro Closure • Recursive Dynamics • Data • Parameters of the model
Environmental part of the three-regional model • Emission of Pollutant CO2,SO2,NMVOC,NOX,PM10, CH4 and N2O • The impact on human health and other environmental end-points like crop damage and material damage • Additional topic-Biomass
In the three regional CGE model, the total amount of a given polluting emission takes the following form:
where i is the sector index, j the consumed product index, C intermediate consumption, XP output, XA final consumption, the emission volume associated with one unit consumption of product j used by sector i; the emission volume associated with one unit production of sector i. the emission volume associated with one unit consumption of product j in final consumption .
Health benefit Emission Change Step 1: introduce of dispersion model Estimate impacts on air pollution exposure Step 2: introduce of dose-response function Estimate impacts on mortality etc. health risk end-points Step 3: introduce of VSL (Value of a statistical life) Estimate units values of health risk end-points
Biomass • In China the biomass energy plays a very important role in the total energy consumption, especially in rural energy consumption and plays an important role in the discharge of GHG. • While we consider only commercial energy sources both renewable and natural resources are explicitly treated. Traditional biomass fuels are ignored since national accounts and official input-output data do not include their value (Rana, 1999).
In China, the biomass also does not introduce into the official account • How to Import the residential combustion of biomass to China’s environmental CGE
Import biomass to CGE • What determines the choice of biomass energy • Key issues of adding the biomass energy in the model • The function for the biomass consumption
Figure 2: The transition of energy consumption Agricultural Modernization Development Township Enterprises Development Labor Transfer From Agriculture To Other Industries etc. The Increase income Of Peasants Development of large mines and power generation etc. High Quality of Living Standard Demand Construction and Opening-up of energy market Supply Energy ladder Transition of Energy Consumption Substitution Decrease of the biomass energy consumption
The factors • Cost Opportunity cost of collecting biomass and price of other energy • Income • Living custom etc.
Key issues of adding the biomass energy in the model • “Exogenous”-simple • “Semi-exogenous” • “Endogenous”-complicated
The function for the biomass consumption • Demand -income • Supply -the forest coverage rate and per cap output of grain
Where, denote the forest coverage rate and per cap output of grain respectively.
For the data of non-commercial biomass consumption in rural area, there is only ten-years-series data of non-commercial biomass consumption at national level. Maybe the data is too short for econometric analysis. • Fortunately we have pooled data, non-commercial biomass consumption by province (31 provinces) and by years (1991, 1992, 1993, 1995, 1996, 1998, and 1999). So our empirical analysis is based on the pooled data.
Notes: * Per capita annual biomass consumption in national level, unit:10-3tce/person.
“Semi-exogenous” • Link the biomass consumption function to the model -the income is the linkage
Further Analysis • To design scenarios of China’s WTO accession • To analyze environmental implications of China’s WTO accession