Download
1 / 2

E N D
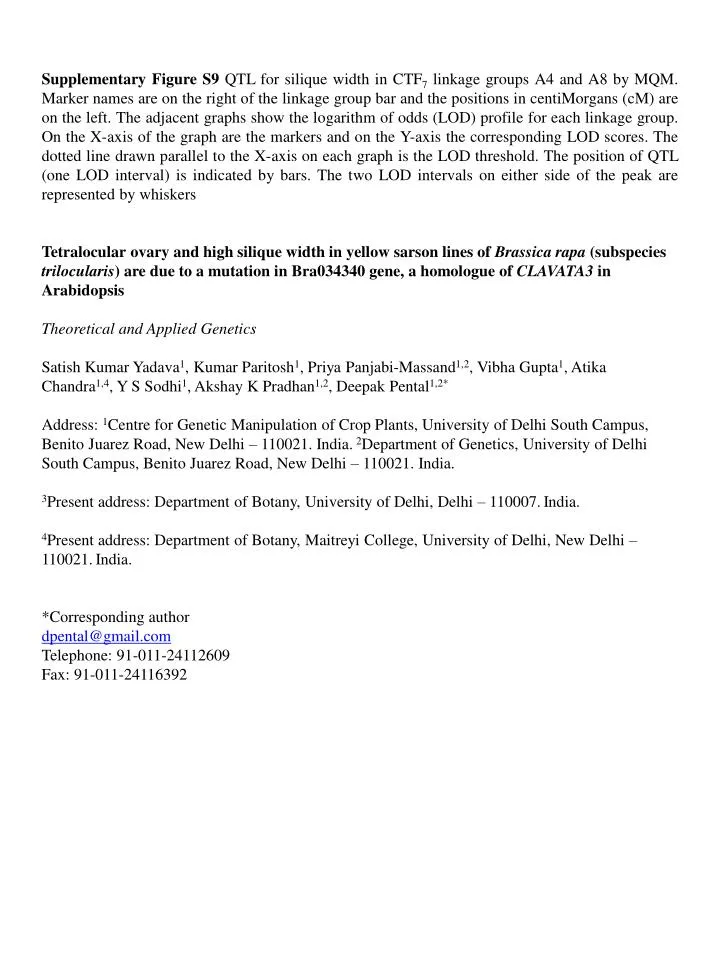
Supplementary Figure S9 QTL for silique width in CTF7 linkage groups A4 and A8 by MQM. Marker names are on the right of the linkage group bar and the positions in centiMorgans (cM) are on the left. The adjacent graphs show the logarithm of odds (LOD) profile for each linkage group. On the X-axis of the graph are the markers and on the Y-axis the corresponding LOD scores. The dotted line drawn parallel to the X-axis on each graph is the LOD threshold. The position of QTL (one LOD interval) is indicated by bars. The two LOD intervals on either side of the peak are represented by whiskers Tetralocular ovary and high silique width in yellow sarson lines of Brassica rapa (subspecies trilocularis) are due to a mutation in Bra034340 gene, a homologue of CLAVATA3 in Arabidopsis Theoretical and Applied Genetics Satish Kumar Yadava1, Kumar Paritosh1, Priya Panjabi-Massand1,2, Vibha Gupta1, Atika Chandra1,4, Y S Sodhi1, Akshay K Pradhan1,2, Deepak Pental1,2* Address: 1Centre for Genetic Manipulation of Crop Plants, University of Delhi South Campus, Benito Juarez Road, New Delhi – 110021. India. 2Department of Genetics, University of Delhi South Campus, Benito Juarez Road, New Delhi – 110021. India. 3Present address: Department of Botany, University of Delhi, Delhi – 110007.India. 4Present address: Department of Botany, Maitreyi College, University of Delhi, New Delhi – 110021.India. *Corresponding author dpental@gmail.com Telephone: 91-011-24112609 Fax: 91-011-24116392
A4-CTF7 A8-CTF7 At2g44610.1 0.0 BC_CT_1185 2.7 BC_CT_1282 BC_CT_1280 4.4 At2g43430 6.2 BC_CT_1155 7.0 BC_CT_1014 8.5 BC_CT_1236 9.7 BC_CT_1237 10.1 BC_CT_1235 10.9 At2g40890 11.5 BC_CT_1187 13.2 cnu_m360a.1 16.1 BC_CT_1021 16.2 BC_CT_1015 18.3 BC_CT_1086 19.8 At2g35990 20.7 BC_CT_1254 23.0 At2g33040.2 25.8 BC_CT_1253 29.1 BC_CT_1109 29.3 0 1 2 3 4 5 6 0 1 2 3 4 5 BC_CT_1623 32.6 At1g09330(1g15-LP) 0.0 BC_CT_1630 33.0 BC_CT_1631 33.5 BC_CT_1628 33.7 At2g27170 33.9 BC_CT_1621 34.0 At1g03180(1g4) 8.8 BC_CT_1622 34.1 At1g18340.1(1g25.1) 14.9 BC_CT_1625 34.2 At1g19130(1g141) 21.8 BC_CT_1624 34.3 BC_CT_1194 23.5 BC_CT_1619 34.4 BC_CT_1085 23.7 CLAVATA3 BC_CT_1197 28.1 35.2 tet-o BC_CT_1070 28.6 BC_CT_1627 35.7 BC_CT_1196 28.7 BC_CT_1626 35.9 BC_CT_1009 29.0 BC_CT_1629 36.1 At1g28530(1g34-LP) 29.2 BC_CT_1614 36.4 BC_CT_1069 29.9 BC_CT_1612 36.7 BC_CT_1068 31.1 BC_CT_1617 37.2 BC_CT_1201 33.7 BC_CT_1616 BC_CT_1203 34.3 37.9 BC_CT_1606 BC_CT_1202 34.6 BC_CT_1140 38.2 BC_CT_1200 34.8 BC_CT_1608 38.7 BC_CT_1066 35.0 BC_CT_1609 40.3 BC_CT_1199 35.5 BC_CT_1613 40.8 cnu_m518a 37.1 BC_CT_1610 BC_CT_1065 38.3 41.5 BC_CT_1186 BC_CT_1165 41.4 BC_CT_1611 42.0 BC_CT_1195 41.8 BC_CT_1646 42.9 cnu_m490a 42.6 BC_CT_1634 43.1 BC_CT_1107 43.3 CTF7-Sw4 At5g40200 43.7 BC_CT_1020 43.6 CTF7-Sw8 BC_CT_1647 45.6 BC_CT_1166 43.9 BC_CT_1644 46.4 BC_CT_1198 44.5 BC_CT_1588 46.6 BC_CT_1557 44.7 BC_CT_1589 46.7 BC_CT_1556 BC_CT_1642 46.8 BC_CT_1152 44.9 BC_CT_1640 47.1 BC_CT_1555 45.9 At2g44860 BC_CT_1558 47.2 BC_CT_1639 BC_CT_1529 46.1 BC_CT_1641 BC_CT_1423 46.2 47.3 BC_CT_1645 BC_CT_1151 46.3 BC_CT_1590 47.4 BC_CT_1218 BC_CT_1638 47.9 BC_CT_1108 46.6 BC_CT_1591 48.0 BC_CT_1106 47.1 BC_CT_1633 48.3 BC_CT_1105 47.2 BC_CT_1594 48.6 BC_CT_1103 47.3 BC_CT_1593 BC_CT_1104 48.1 48.8 BC_CT_1592 BrGMS64(252) 51.5 BC_CT_1605 49.2 cnu_m300a 52.2 BC_CT_1635 49.7 At1g53460(1g76) 57.6 BC_CT_1595 49.9 BC_CT_1598 BC_CT_1037 50.0 BC_CT_1599 BC_CT_1597 50.2 BC_CT_1600 BC_CT_1039 BC_CT_1143 50.5 BC_CT_1601 50.7 BC_CT_1604 50.9 BC_CT_1603 51.0 BC_CT_1632 51.2 BC_CT_1602 BC_CT_1164 52.0 BC_CT_1163 52.2 At5g37600.1 52.8 BC_CT_1188 53.7 BC_CT_1189 53.9 BC_CT_1231 55.9 BC_CT_1078 59.1 BC_CT_1077 59.8 BC_CT_1011 60.4 cnu_m566a 61.7 Supplementary Figure S9 QTL for silique width in CTF7 linkage groups A4 and A8 by MQM. Marker names are on the right of the linkage group bar and the positions in centiMorgans (cM) are on the left. The adjacent graphs show the logarithm of odds (LOD) profile for each linkage group. On the X-axis of the graph are the markers and on the Y-axis the corresponding LOD scores. The dotted line drawn parallel to the X-axis on each graph is the LOD threshold. The position of QTL (one LOD interval) is indicated by bars. The two LOD intervals on either side of the peak are represented by whiskers