Download
1 / 16
190 likes | 837 Views
V.R. Eaton High School Attendance Boundary. November 18, 2013. NISD Growth History. Sept 00 5,373. Sept 01 5,641. Sept 04 7,595. Sept 05 8,678. Sept 06 10,354. Sept 07 11,804. Sept 09 14,100. Sept 10 15,400. Sept 11 16,600. Sept 12 17,800. Sept 13 19,001. Sept 02 6,199.

E N D
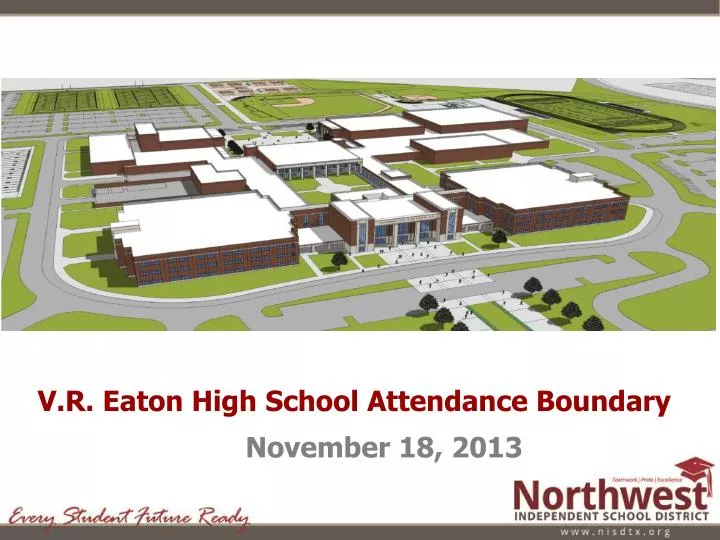
V.R. Eaton High School Attendance Boundary November 18, 2013
NISD Growth History Sept 00 5,373 Sept 01 5,641 Sept 04 7,595 Sept 05 8,678 Sept 06 10,354 Sept 07 11,804 Sept 09 14,100 Sept 10 15,400 Sept 11 16,600 Sept 12 17,800 Sept 13 19,001 Sept 02 6,199 Sept 03 6,891 Sept 08 13,026 268 5% 558 9% 692 11% 704 10% 1,083 14% 1,676 19% 1,459 14% 1,222 11% 1,074 8.5% 1,300 9% 1,200 8% 1,200 7.3% 1,200 6.7% September 2017 projected enrollment 25,000 students
2001-02 Enrollment- 5,641 2012-13 Enrollment 17,800 9,066 Students 2,740 Students 2,251 Students 1,271 Students
50 Northwest Independent School District 2012 Development Map 49 51 37 36 48 46 47 8 42 35 43 44 39 41 45 9 38 40 5 1 2 6 34 7 4 10 33 31 3 32 11 19 29 22 21 12 13 20 14 27 28 26 30 25 15 16 23 18 24 17
Top 10 Developments In 2012 Development Elementary Attendance Zone 2009-10 Rank • Highlands of TC Beck Elementary Unranked • Sendera Ranch Thompson Elementary 1 • Highlands of TC Lakeview Elementary Unranked • Rivers Edge Hatfield Elementary Unranked • Harmon Ranch Peterson Elementary Unranked • Briarwyck Roanoke Elementary 4 • Turnberry Lakeview Elementary Unranked • Tehama Ridge Peterson Elementary 6 • Sendera Ranch Sendera Ranch Elementary 1 • Trails of Fossil Creek Nance Elementary Unranked
Boundary Review Boundary Change History • August 2002- Realigned all elementary school attendance zones • 2002- Placed Chisholm Creek in Seven Hills attendance zone • 2003- Placed Sendera Ranch in Prairie View attendance zone • 2002 & 2004 Property Exchange with Keller ISD • March 2005- Established Hughes and Nance Elementary School Attendance Boundaries • March 2006- Established Granger Elementary School Attendance Boundaries • November 2007- Established boundaries for Byron Nelson High School • March 2008- Established Boundaries for Sendera Ranch Elementary School and O.A. Peterson Elementary School • March 2009- Established boundaries for Clara Love Elementary School, Justin Elementary School, and Hatfield Elementary School • January 2010- Established boundaries for Tidwell Middle School • March 2011- Established boundaries for Schluter Elementary School • March 2011- Established boundaries for Thompson Elementary School • November 2011- Established boundaries for Wilson Middle School • 2013- Established boundaries for Cox Elementary School • 2013- Revised the attendance boundaries between Granger Elementary School and Hughes Elementary School • 2013- Revised the attendance boundaries between Hatfield Elementary School and Love Elementary School
Purpose of Boundary Recommendations • Develop Long Range Boundary Strategies • Establish Attendance Boundaries • Improve Efficiency of Schools • Minimize Future Changes
Basic Steps for Boundary Development • Review District Needs • Review Growth Projections • Establish Tentative Boundaries • Review with Communities • Make Recommendation to the School Board • Boundaries Established by the School Board
Northwest High School- Projections • 2014-15 2,890 • 2015-16 3,109 • 2016-17 3,335 • 2017-18 3,499 • 2018-19 3,691 • 2019-20 3,866 Current High School Boundaries Please note the enrollment projections are based on the actual 2013-14 enrollment and do not reflect the impact of the academies Northwest High School Byron Nelson High School • Byron Nelson High School- Projections • 2014-15 2,399 • 2015-16 2,552 • 2016-17 2,670 • 2017-18 2,960 • 2018-19 3,246 • 2019-20 3,510
Northwest High School- Projections • 2014-15 2,890 • 2015-16 2,256 • 2016-17 2,127 • 2017-18 2,200 • 2018-19 2,354 • 2019-20 2,518 Proposed High School Boundaries Please note the enrollment projections are based on the actual 2013-14 enrollment and do not reflect the impact of the academies Northwest High School Byron Nelson High School V.R. Eaton High School • V.R. Eaton High School- Projections • 2014-15 0 • 2015-16 1,035 • 2016-17 1,627 • 2017-18 2,029 • 2018-19 2,219 • 2019-20 2,374 • Byron Nelson High School- Projections • 2014-15 2,399 • 2015-16 2,371 • 2016-17 2,251 • 2017-18 2,231 • 2018-19 2,365 • 2019-20 2,483
May 2013 October 2013
Schluter Elementary site