Download

1 / 0
0 likes | 102 Views
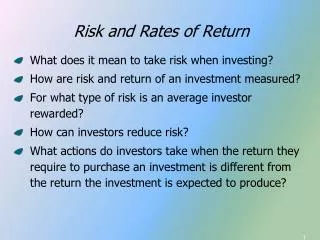
Required rate of return When valuing assets and firms, we need to use discount rates that reflect the riskiness of the cash flows. What is risk? In finance, it refers to the likelihood that we will receive a return on an investment that is different from the return that we expect to make

E N D