Download
1 / 21
210 likes | 215 Views
Private capital flows to developing countries reached record levels in 2005, with significant growth in South-South flows. Donors have increased their aid effort for the poorest countries. However, risks and vulnerabilities remain. This article discusses the factors contributing to the growth in capital flows and highlights policy implications for developing countries and the international community.

E N D
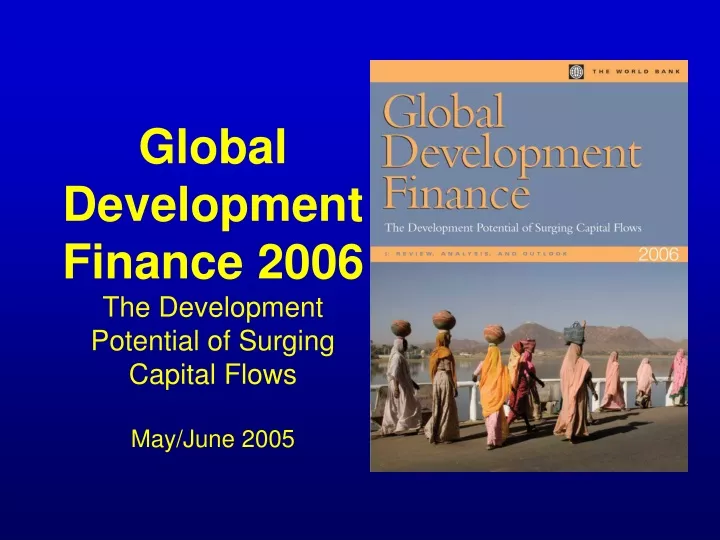
Global Development Finance 2006The Development Potential of Surging Capital FlowsMay/June 2005
2005 – A Landmark Year in Development Finance • Private capital flows have reached record levels • South-South flows are important aspect of development finance • For the poorest countries, donors have enhanced their aid effort • Risks and vulnerabilities remain
Private capital flows to developing countries grew at record pace in 2005 Total net private capital flows to developing countries $ billions Percent Percent of GDP (right axis) $491 billion in 2005 2005
$137 billion $62 billion $61 billion $238 billion …with all types of private flows recording gains in 2005 $ billions
Both global and domestic factors have contributed • On the global side • Booming international trade • Relatively low international interest rates • On the domestic side • Improved domestic monetary and exchange rate policy • Large official reserve holdings • Better external debt management • Development of local debt markets • Improved corporate governance in some countries
Developing-country credit quality improved markedly in 2005 Number of credit upgrades/downgrades by Fitch, Moody’s and S&P
Net private debt flows have fluctuated substantially… Net private debt flows to developing countries $ billion Percent Percent of GDP (right axis) $192 billion in 2005 (left axis)
…portfolio equity flows have also been volatile Net portfolio equity inflows to developing countries,1990-2005 $ billion Percent $61 billion in 2005 (left axis) Percent of GDP (right axis)
…while more stable FDI accounted for half of net private flows Net FDI inflows to developing countries $ billion Percent $237 billion in 2005 (left axis) Percent of GDP (right axis)
Developing economies are highly integrated with each other Share of flows to developing countries and originating from developing countries Percent Developing countries’ GDP as a share of global GDP
South-South FDI is significant in banking sector, particularly in low income countries Share of South-South in total foreign bank assets Share of South-South in total number of foreign banks Percent Percent Low Income Middle Income All Developing Low Income Middle Income All Developing
Donors continue to scale-up aid… Net ODA disbursements from DAC donors $106.5 billion in 2005 $79.6 billion in 2004 Debt relief Other special purpose grants Other components of ODA
…and enhance commitments for future aid Net ODA as a percent of GNI in DAC donor countries, 1990-2005 Projection: 2006-10 Percent 0.36% in 2010 0.33% in 2005 Total ODA excluding debt relief to Iraq and Nigeria 0.27% in 2005
The MDRI will forgive most of the debt in countries that qualify External debt as a percent of GDP Before HIPC and MDRI debt relief After HIPC and MDRI debt relief * 18 HIPCs that have reached the completion point
This time around, what has changed? • More flexible exchange rate regimes: 62 percent of countries versus 33 percent during the previous episode • Oil exporters and emerging Asia now have sizable current account surpluses and reserves • External debt positions have improved • More countries have developed local debt markets • Less reliance on short-term bank debt • Equity flows dominate: FDI accounts for 57 percent of private capital flows versus 47 percent last time
Improved external debt profile Selected indicators of external debt burden 1997 2002 2003 2004 2005 Debt stock/ GDP 36.9 39.0 37.8 34.6 29.8 Debt stock / Exports 135.5 116.9 106.3 88.6 79.6 Debt service / Exports 18.9 18.5 17.3 14.5 12.7 Reserves / ST-debt 147.6 272.6 288.0 326.7 361.0 Reserves / Imports (months) 4.4 5.9 6.5 6.8 7.4 Percent
But, risks and vulnerabilities remain • Heightened market anxiety associated with global payments imbalances • Possibility of higher global interest rates and economic slow-down • Uncertainties associated with geopolitical risks • Higher inflation expectations and possibility of more aggressive monetary policy responses • Recent pace of sterilized intervention and reserve accumulation in emerging market economies is not sustainable
With U.S. monetary tightening, emerging market bond spreads have widened recently Percent Basis points US Federal Funds rate (right) EMBIG spreads (left)
Boom in local equity market prices has raised the risk of sharp market correction Jan. 2004 = 100 Emerging Market equity price index (MSCI ) FTSE 100 S&P
Policy implications • For developing countries… • Consistency of monetary and exchange rate policy in an increasing open capital account environment • Sound fiscal policy to promote price stability • For the international policy community… • Multilateral cooperation to prevent disorderly market reaction to global imbalances
continued…Policy implications • Aid effectiveness: a mutual responsibility • Donor commitments: • Follow through on pledges to enhance aid and debt relief • Implementation of Paris Declaration • Selectivity -- ensure aid allocations in line with development priorities • Recipient commitments: • Improve governance, institutions • Prudence approach to commercial borrowing, while maintaining debt sustainability