1 / 10

Comparison of the Operating Reserve Demand Curve Augmentations

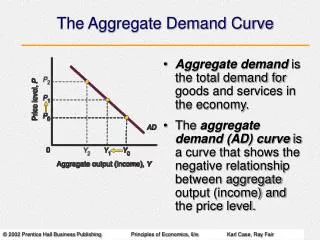
Comparison of the Operating Reserve Demand Curve Augmentations. John Dumas Director of Wholesale Market Operations RATF March 24, 2014. Impact on ORDC with various proposals. Impact on Peaker Net Margin (PNM) on 1/6/2014 and 3/3/2014(in $/MW-year):. Original Ps PNM $2,158.52/MW-year

Download Presentation

Comparison of the Operating Reserve Demand Curve Augmentations

An Image/Link below is provided (as is) to download presentation Download Policy: Content on the Website is provided to you AS IS for your information and personal use and may not be sold / licensed / shared on other websites without getting consent from its author. Content is provided to you AS IS for your information and personal use only. Download presentation by click this link. While downloading, if for some reason you are not able to download a presentation, the publisher may have deleted the file from their server. During download, if you can't get a presentation, the file might be deleted by the publisher.

E N D

Presentation Transcript


  1. Comparison of the Operating Reserve Demand Curve Augmentations John Dumas Director of Wholesale Market Operations RATF March 24, 2014

  2. Impact on ORDC with various proposals • Impact on Peaker Net Margin (PNM) on 1/6/2014 and 3/3/2014(in $/MW-year):

  3. Original Ps PNM $2,158.52/MW-year Ps with SD added $5,953.63/MW-year PS with 500 MW added $3,129.38/MW-year

  4. Original Ps PNM $2,158.52 /MW-year Ps with RUC HSL pulled $3,127.62 /MW-year

  5. Original Ps PNM $644.71/MW-year Ps with SD added $3,510.95/MW-year PS with 500 MW added $1,314.77/MW-year

  6. Original Ps PNM $644.71/MW-year Ps with RUC HSL pulled $6,609.93/MW-year

  7. HSL of RUC Capacity from 1/1/2014 to 3/4/2014

  8. PNM impact by Day for 1/1/14 to 3/4/14 (1 SD Adder)

  9. PNM impact by Day for 1/1/14 to 3/4/14 (500 MW Adder)

  10. PNM impact by Day for 1/1/14 to 3/4/14 (RUC HSL Adder)

More Related