Download
1 / 16
170 likes | 330 Views
fMRI: Biological Basis and Experiment Design Lecture 8: Pulse sequences, Take 2. Gradient echo review K-space review Slice selection K-space navigation Bandwidth Echo time Read-out time. - . . 0. The read-out signal is the 1D FFT of the sample. G RO. Magnitude of signal in RF coil.

E N D
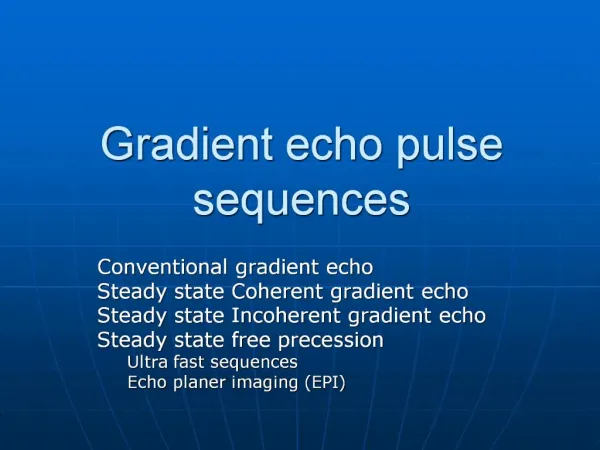
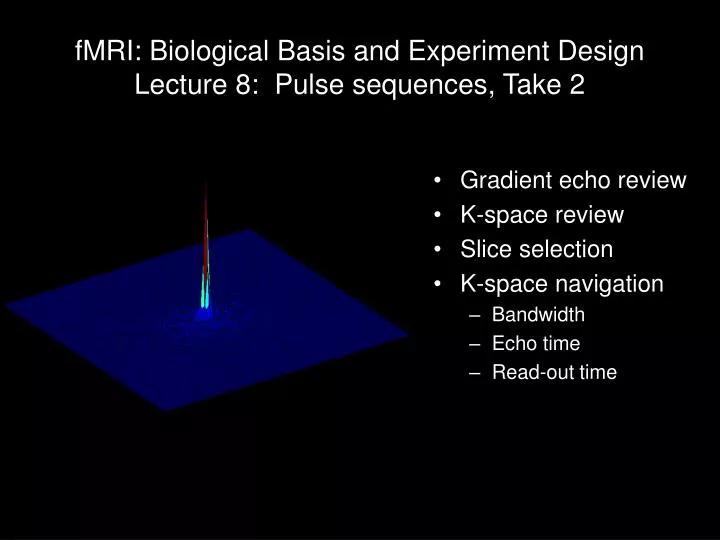
fMRI: Biological Basis and Experiment DesignLecture 8: Pulse sequences, Take 2 • Gradient echo review • K-space review • Slice selection • K-space navigation • Bandwidth • Echo time • Read-out time
- 0 The read-out signal is the 1D FFT of the sample GRO Magnitude of signal in RF coil Real part of signal in RF coil Imaginary component of signal in RF coil
Pulse sequence diagram: slow 2D FLASH (64 x 64) Nrep = 64 Flip angle ~ 56 deg. TR ~ 640us RF GSS PE table increments each repetition GPE GRO 64 points DAC
f G = 5.1kHz/cm RF Pulse (bandwidth = 1kHz) x Excited slice thickness = BWRF/G = 0.2cm = 2mm Slice selection
f G = 5.1kHz/cm x Slice selection - edges aren’t exactly hard BW thk = BW/GSS Frequency profile of pulse = spatial profile of slice
f x Slice thickness is determined by bandwidth of pulseSlice position is determined by center frequency of pulse
f x 1st TR 30th TR Overlap of slices leads to non-uniform signal intensity for first few TRs
Pulse sequence diagram: normal 2D FLASH (2562) Nrep = 256 Flip angle ~ 7 deg. TR ~ 10ms RF GSS PE table increments each repetition GPE TE ~ 5ms GRO 256 points DAC
Pulse sequence diagram: normal 2D FLASH (2562) Nrep = 256 Flip angle ~ 7 deg. TR ~ 10ms RF Read gradient amplitude, GRO: 35mT/m Dwell time (per data point): 3.5s Sampling rate (bandwidth): 286kHz FOV = 286kHz/(1.49MHz/m) = 19.2cm NRO = 256 TRO (line) = 256*3.5us = 0.9ms Resolution = FOVRO/NRO = 0.75mm Frequency resolution (Hz/pixel) RO: 1.1kHz/px PE: effectively infinite TE = 5ms GSS PE table increments each repetition GPE TE ~ 5ms GRO 256 points DAC
- 0 FLASH sequences read one line per excitation Relative phase of spins
- 0 EPI sequences zig-zag back and forth across k-space
Pulse sequence diagram: EPI (64 x 64 image) Nrep = 32 RF GSS GPE GRO 64 pts 64 pts DAC
Pulse sequence diagram: EPI (64 x 64 image) Read gradient amplitude, GRO: 35mT/m Dwell time (per data point): 3.5s Sampling rate (bandwidth): 286kHz FOV = 286kHz/(1.49MHz/m) = 19.2cm NRO = 64 TRO (line) = 64*3.5us = 0.224ms TRO (image) = 64*64*3.5us = 14.3ms Resolution = FOVRO/NRO = 3.0mm Frequency resolution (Hz/pixel) RO: 4.5kHz/px (1/TRO,line) PE: 70 Hz/px (1/TRO,image) TEmin = TRO/2 + fudge = 9ms RF GSS … GPE … GRO 64 64 64 64 64 64 DAC
Pulse sequence diagram: EPI (more realistic) Read gradient amplitude, GRO: 15mT/m Dwell time (per data point): 8.1s Sampling rate (bandwidth): 122kHz FOV = 122kHz/(0.64MHz/m) = 19.2cm NRO = 64 TRO (line) = 64*8.1us = 0.518ms TRO (image) = 64*64*3.5us = 33ms Resolution = FOVRO/NRO = 3.0mm Frequency resolution (Hz/pixel) RO: 1.9 kHz/px (1/TRO,line) PE: 30 Hz/px (1/TRO,image) TEmin = TRO/2 + fudge = 18ms RF GSS … GPE … GRO 64 64 64 64 64 64 DAC
Pulse sequence: 3D FLASH (176 x 224 x 256) Nrep = 176 x 224 Slab is selected with very weak gradient ky RF kz Partition Encoding increments every 224 repetitions GSS kx PE table increments each repetition; cycles for each partition GPE GRO 256 points DAC