Download
1 / 21
210 likes | 340 Views
Interactions between Simulated S upercell Thunderstorms and Dry B oundary L ayer C onvection. Christopher Nowotarski , Paul Markowski , Yvette Richardson Pennsylvania State University George Bryan National Center for Atmospheric Research 14 th Conference on Mesoscale Processes

E N D
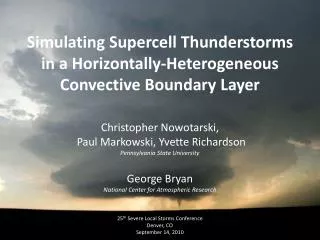
Interactions between Simulated Supercell Thunderstorms and Dry Boundary Layer Convection Christopher Nowotarski, Paul Markowski, Yvette Richardson Pennsylvania State University George Bryan National Center for Atmospheric Research 14th Conference on Mesoscale Processes Los Angeles, CA August 2, 2011
Motivation • Previous 3D numerical simulations of supercells and tornadoes generally use horizontally homogeneous environments and exclude surface fluxes. • Observations and simulations suggest that supercells are favored in areas with significant vertical wind shear and instability (CAPE). • Convective Boundary Layers (CBLs) are characterized by local variations in these quantities. • Consequently, supercells simulated in such environments may behave differently than in a homogeneous environment.
Background Less Shear • Mesoscale variations in low-level vertical wind shear and moisture “profoundly influence the morphology of deep convective storms” (Richardson et al. 2007, Richardson 1999). • Storms became more organized and stronger when moving to areas of increased shear. • Storms propagated towards areas of increased low-level moisture in weak shear regimes • Isolated supercells in areas of increased moisture showed both higher updraft speeds and stronger low-level rotation. • Tornadoes tend to be more likely in environments with higher 0-1 km shear and lower lifting condensation levels (e.g., Rasmussen and Blanchard 1998, Thompson et al. 2003, Markowski et al. 2003, Craven and Brooks 2004) Constant Shear More Shear
Background • Boundary layer convection is a source of heterogeneity in the atmosphere. • Because of low-level shear requirements, supercell environments are likely characterized by horizontal convective rolls (HCRs) or disorganized convection. • Variations in thermodynamic quantities result from increased convergence in updraft branches. (Weckwerth et al. 1996) -Potential temperature can be 0.5 K higher in updraft -Mixing ratio is 1.5 – 2.5 g kg-1 higher in updraft • Increased instability, lower LCLs, and favored regions for cloud formation in updraft branches. • Roll axes tends to be aligned with mean CBL wind (Weckwerth et al. 1999) • Organized boundary layer convection results in local, periodic variations in low-level vertical wind shear. • Maxima in shear tend to be in areas without strong magnitudes of vertical velocity. (from: Weckwerth et al. 1996) (from: Markowski and Richardson 2007)
Background Low-level winds Storm motion Gravity waves? HCR axis (from: NOAA comprehensive Large Array-Data Stewardship System) 24 May 2008
Experiment Goals • Simulate a convective boundary layer (CBL) with horizontal convective rolls • Simulate supercell thunderstorms using an organized CBL as the base state • compare with a homogeneous base state • Examine effects of storms, particularly anvil shading, on CBL
Model Configuration • Model • CM1, version 1, release 15 (Bryan 2002) • Δt = 2.0 s, 0.33 s for acoustic calculations • periodic lateral boundary conditions • Grid • dimensions: 250 km x 200 km x 18 km • Δx, Δy = 500 m • Δz = stretched from 50 m (below 3 km) to 500 m (above 9.5 km) • Parameterizations • Ice microphysics (Lin et al. 1983) • Deardorff(1980) 1.5-order subgridscale (SGS) turbulence scheme CBL simulations only: • Land surface scheme using two-layer soil model • Independent column approximation radiative transfer (NASA Goddard Cumulus Ensemble; Chou 1990,1992; Chou et al. 1998;Tao et al. 1996; Chou et al. 1999 )
Generating a Convective Boundary Layer Initial Profile: 35 m s-1 unidirectional 0-6 km shear 1521 J kg-1 SBCAPE 323 J kg-1 CIN 3580 J kg-1 MUCAPE CBL Initialization: Radiation corresponding to 7:00 a.m. CDT in Northern Oklahoma +/- 0.1 K potential temperature perturbations added After 5 hours of simulation time…. Increasing solar angle warms and moistens boundary layer, causing CBL development Average 11:45 a.m. CDT thermodynamic profile: 3855 J kg-1 SBCAPE 40 J kg-1 SBCIN 3855 J kg-1 MUCAPE CBL mixes out low-level momentum, but deep layer shear remains relatively similar
CBL Characteristics Daytime heating drives increase in resolved and subgrid scale (SGS) turbulence kinetic energy (TKE). Around 11:30 a.m. CDT, large increase in resolved TKE associated with transition from nocturnal to convective boundary layer CBL deepens with time through early afternoon hours
CBL Results • Simulated CBL (before storm initiation) HCR axis z zi CBL is organized into SW-NE oriented horizontal convective rolls (HCRs) Velocity and temperature perturbations of scales expected by theory/observations
CBL Results Water vapor mixing ratio (qv) increases in HCR updraft branches by up to 0.3 g kg-1 0-1 km shear is locally increased by up to 3 m s-1 Shear maxima tend to be where vertical velocity is weak
Experiment Design • Three simulations of supercell thunderstorms with varying environments • CBL_fixed • Initializes deep convection in an organized CBL, with incoming solar radiation fixed and no cloud shading effects • CBL_evolve • Initializes deep convection in an organized CBL with evolving radiation, including cloud shading effects • Control • Supercell is simulated in a horizontally-homogeneous base state (average profiles from initialization of CBL_fixed/CBL_evolve), without radiation or surface fluxes • Compare simulations, focusing on behavior and structure of mature storms (rather than initiation).
Supercell Initiation • Each supercell experiment is initialized using CBL environment or a homogeneous base state with average values from CBL environment at 11:45 a.m. CDT. • Deep convection is initialized with an ellipsoidal warm bubble perturbation • 3 K potential temperature perturbation • 10 km x 10 km x 1 km radius • Simulations are continued for 2 hours while supercells evolve
Simulation Results Maximum vertical velocity Aloft: Largely similar midlevel updraft strength With time, CBL simulations display slightly stronger updraft (likely the influence of increasing CAPE in CBL simulations due to radiation/surface fluxes) Low levels: Initially stronger updrafts in CBL simulations due to HCRs Similar strength low-level updraft once deep convection develops 4 km AGL w (m s-1) 125 m AGL Time
Simulation Results Surface maximum vertical vorticity Low-level vorticity is initially stronger in CBL simulations (owing to HCRs) After 1:30 p.m., control displays stronger low-level vertical vorticity than either CBL simulation, despite having less CAPE CBL_evolve also has a period of strong low-level rotation ζ (s-1) Time
Simulation Results – 4 km AGL 1:50 p.m. All three simulations have similar strength updrafts co-located with vertical vorticity w max = ~40 m s-1 ζ max = ~0.05 s-1 CBL_fixed and CBL_evolve contain numerous vertical vorticity maxima associated with cumulus congestus clouds in both the cold pool and inflow regions
Simulation Results – low levels 1:50 p.m. • Control has strong, organized low-level updraft along gust front, with well-defined vertical vorticity maximum • CBL_fixed has slightly weaker, less organized low-level updraft and little evidence of a low-level mesocyclone. More misocyclone-like vort maxima along gust front • CBL_evolve shares characteristics with both simulations, likely owing to less vigorous boundary layer convection
Effects of cold pool and anvil-shading Colder surface temperature under anvil Anvil cloud edge Weaker boundary layer convection under anvil… Decreased incoming shortwave radiation at surface … and in cold pool HCR updrafts in “sunny” areas
Conclusions • Inclusion of radiation and surface fluxes, (causing CAPE to increase during simulation) leads to slight increase in midlevel updraft strength • CBL does not cause significant differences in overall storm strength (i.e., midlevel updraft strength or rotation) • Presence of HCRs appears to disrupt development of low-level mesocyclone in CBL simulations, but leads to increased misocyclone activity along gust front • Anvil-shading weakens boundary layer convection in inflow, perhaps mitigating its effects on storm evolution
Future Work • Higher resolution simulations to better resolve fine-scale differences • Vary orientation of HCRs relative to storm motion • Vary position of storm anvil relative to storm motion/inflow • More realistic radiation scheme (e.g., the titled independent pixel approximation) • Simulate during late afternoon/evening hours when supercells tend to be at their prime
Acknowledgments • NSF grant AGS-0644533 • Computing resources and support provided by NCAR CISL • Thanks to Nels Shirer, Marcelo Chamecki, and Jim Marquis for helpful input