Download
1 / 1
10 likes | 74 Views
Modeling Coupled Biogeochemical and Hydrologic Processes in Field Experiments at the Oak Ridge IFRC Involving pH Manipulation and Electron Donor Injection Guoping Tang 1 , Fan Zhang 2 , Jack Parker 3 , Scott Brooks 1 , Dave Watson 1 , Baohua Gu 1 , Weimin Wu 4 , Chris Schadt 1 , Mike Kowalski 5

E N D
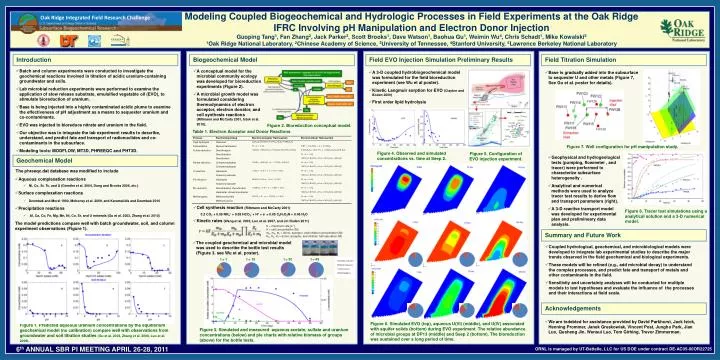
Modeling Coupled Biogeochemical and Hydrologic Processes in Field Experiments at the Oak Ridge IFRC Involving pH Manipulation and Electron Donor Injection Guoping Tang1, Fan Zhang2, Jack Parker3, Scott Brooks1, Dave Watson1, Baohua Gu1, Weimin Wu4, Chris Schadt1, Mike Kowalski5 1Oak Ridge National Laboratory, 2Chinese Academy of Science, 3University of Tennessee, 4Stanford University, 5Lawrence Berkeley National Laboratory Introduction Biogeochemical Model Field Titration Simulation Field EVO Injection Simulation Preliminary Results • Batch and column experiments were conducted to investigate the geochemical reactions involved in titration of acidic uranium-containing groundwater and soils. • Lab microbial reduction experiments were performed to examine the application of slow release substrate, emulsified vegetable oil (EVO), to stimulate bioreduction of uranium. • Base is being injected into a highly contaminated acidic plume to examine the effectiveness of pH adjustment as a means to sequester uranium and co-contaminants. • EVO was injected to bioreduce nitrate and uranium in the field. • Our objective was to integrate the lab experiment results to describe, understand, and predict fate and transport of radionuclides and co-contaminants in the subsurface. • Modeling tools: MODFLOW, MT3D, PHREEQC and PHT3D. • A conceptual model for the microbial community ecology was developed for bioreduction experiments (Figure 2). • A microbial growth model was formulated considering thermodynamics of electron acceptor, electron donator, and cell synthesis reactions (Rittmann and McCarty 2001, Istok et al. 2010). • A 3-D coupled hydrobiogeochemical model was formulated for the field bioreduction experiment (see Wu et al poster). • Kinetic Langmuir sorption for EVO (Clayton and Boden 2009) • First order lipid hydrolysis • Base is gradually added into the subsurface to sequester U and other metals (Figure 7, See Gu et al. poster for details). Figure 2. Bioreduction conceptual model. Table 1. Electron Acceptor and Donor Reactions Figure 7. Well configuration for pH manipulation study. Figure 4. Observed and simulated concentrations vs. time at Seep 2. Figure 5. Configuration of EVO injection experiment. • Geophysical and hydrogeological tests (pumping, flowmeter , and tracer) were performed to characterize subsurface heterogeneity . • Analytical and numerical methods were used to analyze tracer test results to derive flow and transport parameters (right). • A 3-D reactive transport model was developed for experimental plan and prelimineary data analysis. Geochemical Model The phreeqc.dat database was modified to include • Aqueous complexation reactions • Ni, Co, Sr, Tc, and U (Grenthe et al. 2004, Dong and Brooks 2006, etc.) • Surface complexation reactions • Dzombak and Morel 1990, Mohoney et al. 2009, and Karamalidis and Dzombak 2010 • Precipitation reactions • Al, Ca, Co, Fe, Mg, Mn, Ni, Co, Sr, and U minerals (Gu et al. 2003, Zhang et al. 2010) • Cell synthesis reaction (Rittmann and McCarty 2001) Figure 8. Tracer test simulations using a analytical solution and a 3-D numerical model. 0.2 CO2 + 0.05 NH4+ + 0.05 HCO3- + H+ + e- = 0.05 C5H7O2N + 0.45 H2O • Kinetic rates (Wang et al. 2003, Luo et al. 2007, and Jin Roden 2011) The model predictions compare well with batch groundwater, soil, and column experiment observations (Figure 1). K = maximum rate [s-1] X = cell concentration (M) mD, mA, mI = donor, acceptor, and inhibitor concentration (M) KD, KA, KI = donor, acceptor, and inhibitor half saturation (M) Summary and Future Work • The coupled geochemical and microbial model was used to describe the bottle test results (Figure 3. see Wu et al. poster). • Coupled hydrological, geochemical, and microbiological models were developed to integrate lab experimental studies to describe the major trends observed in the field geochemical and biological experiments. • These models will be refined (e.g., add microbial decay) to understand the complex processes, and predict fate and transport of metals and other contaminants in the field. • Sensitivity and uncertainty analyses will be conducted for multiple models to test hypotheses and evaluate the influence of the processes and their interactions at field scale. t = 1 t = 15 t = 30 t = 45 Acknowledgements • We are indebted for assistance provided by David Parkhurst, Jack Istok, Henning Prommer, Janek Greskowiak, Vincent Post, Jungho Park, Jian Luo, Qusheng Jin, Wensui Luo, Tom Girhing, Trevor Zimmerman. Figure 6. Simulated EVO (top), aqueous U(VI) (middle), and U(IV) associated with aquifer solids (bottom) during EVO experiment. The relative abundance of microbial groups at DP13 (middle) and Seep 2 (bottom). The bioreduction was sustained over a long period of time. Figure 1. Predicted aqueous uranium concentrations by the equilibrium geochemical model (no calibration) compare well with observations from groundwater and soil titration studies (Gu et al. 2003, Zhang et al. 2008, Luo et al. 2009). Figure 3. Simulated and measured aqueous acetate, sulfate and uranium concentrations (below) and pie charts with relative biomass of groups (above) for the bottle tests.