Download
1 / 12
150 likes | 283 Views
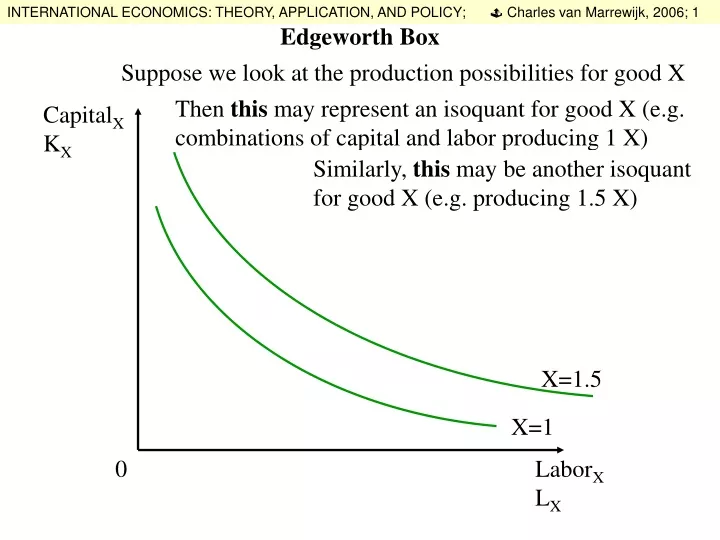
X=1.5. X=1. Edgeworth Box. Suppose we look at the production possibilities for good X. Then this may represent an isoquant for good X (e.g. combinations of capital and labor producing 1 X). Capital X K X. Similarly, this may be another isoquant for good X (e.g. producing 1.5 X). 0.

E N D
X=1.5 X=1 Edgeworth Box Suppose we look at the production possibilities for good X Then this may represent an isoquant for good X (e.g. combinations of capital and labor producing 1 X) CapitalX KX Similarly, this may be another isoquant for good X (e.g. producing 1.5 X) 0 LaborX LX
We might, however, also use our capital and labor to produce Something else, say good Y. Just as with good X we can draw combinations of inputs, capitalY and laborY, to produce a certain level of good Y. Edgeworth Box CapitalY KY For example, the isoquants Y=2 and Y=3 in this figure. Y=3 Y=2 0 LaborY LY
KX KY 0 0 LX LY Edgeworth Box Combining these two possibilities the figure on the left represents isoquants for good X and the figure on the right isoquants for good Y
KX KY 0 0 LX LY Edgeworth Box We can combine the information of these two figures into one figure
KX KY 0 0 LX LY Edgeworth Box We can combine the information of these two figures into one figure
KX KY 0 0 LX LY Edgeworth Box We can combine the information of these two figures into one figure
KX KY 0 0 LX LY Edgeworth Box We can combine the information of these two figures into one figure
KX KY 0 0 LX LY Edgeworth Box We can combine the information of these two figures into one figure
Kx Ly Oy A Ky Ox Lx Edgeworth Box The origin of good Y is in the north-east corner The origin of good X is in the south-west corner Ly and Ky are measured relative to the Oy corner Lx and Kx are measured relative to the Ox corner
K This follows from the upper contour set of good Y at point A L Edgeworth Box Kx Ly Oy We let K be the available capital and L the available labor A Point A is not an efficient allocation of K and L for the production of X and Y Ky Ox Lx
Edgeworth Box Moving K from X to Y and L from Y to X Can increase the production of X without lowering the prod. of Y Kx Ly Oy K The combination of all efficient input allocations is called the A contract curve Ky Ox Lx L
Otherwise, the ppf is a strictly function, that is take 2 arbitrary points on the ppf, such as A and B in the figure Y A B X Edgeworth Box To test whether you understand the Edgeworth Box and the properties of CRS try to derive the special circumstances under which the ppf is a straight line (there are two distinct special cases). concave Connect them with the red straight line, then the value of the ppf must be everywhere above this red straight line As a consequence the production possibility set is that is all points in between 2 arbitrary points that can be produced can also be produced convex,