Download
1 / 30
320 likes | 516 Views
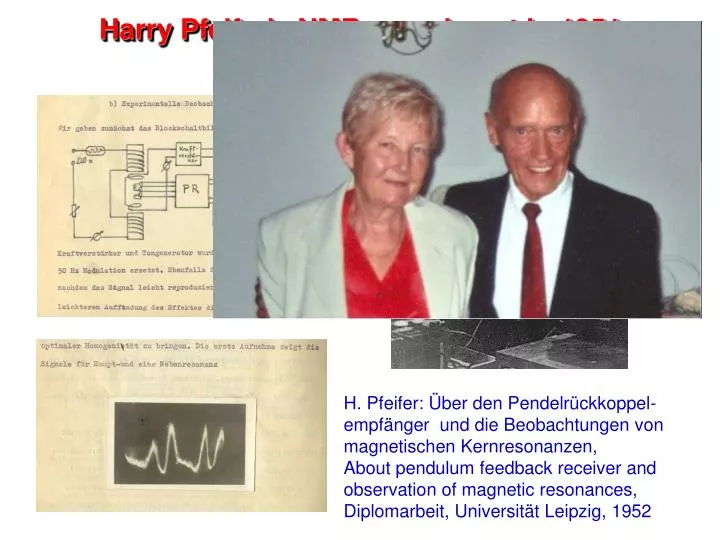
Harry Pfeifer's NMR experiment in 1951. H. Pfeifer: Über den Pendelrückkoppel-empfänger und die Beobachtungen von magnetischen Kernresonanzen, About pendulum feedback receiver and observation of magnetic resonances, Diplomarbeit, Universität Leipzig, 1952. NMR of quadrupolar nuclei.

E N D
Harry Pfeifer's NMR experiment in 1951 H. Pfeifer: Über den Pendelrückkoppel-empfänger und die Beobachtungen von magnetischen Kernresonanzen, About pendulum feedback receiver and observation of magnetic resonances, Diplomarbeit, Universität Leipzig, 1952
NMR of quadrupolar nuclei • WEB of Science refers to approximately 10 000 papers per year, which concern NMR investigations. • 35% of these works refer to 1H, 25% to 13C, 8% to 31P, 8% to 15N, 4% to 29Si and 2% to 19F as one of the nuclei under study. In all these nuclei, we have the nuclear spin I = ½. • If we look at nuclei with a quadruple moment and half-integer spin I > ½, we find the nuclei 27Al in 3% of all the NMR papers and 1% for each of the nuclei 11B, 7Li, 23Na and 51V. • For even numbered spin, only the I = 1 nuclei are frequently encountered: 2H in 4% and 14N and 6Li in 0.5% of all NMR papers.
Solid-state NMRof quadrupolar nuclei with half-integer spin • Introduction to quadrupolar line broadening in solid-state NMR spectra of nuclei with half-integer spin • Excitation problems for solid-state NMR • Double-rotation (DOR) and Multiple-quantum solid-state (MQMAS) NMR of quadrupolar nuclei with half-integer spin • Dieter Freude, Institut für Experimentelle Physik I der Universität LeipzigMETU-Center Workshop on Solid State NMR, 30 and 31 October 2007
History • Classic techniques: single crystal and broad line NMR • Encanced rf power allows pulse excitation and echo observation in broad line NMR • 1980, MAS reduces the powder line broadening of the central transition by 1/4 • 1984, nutation techniques improve the quadrupolar resolution • SATRAS reduces quadrupolar line broadening for powders • 1988, DOR removes line broadening for powders • 1988, DAS removes line broadening for powders • 1995, MQMAS removes line broadening for powders, less laborious than DOR/DAS • MQMAS techniques are improved in sensitivity and resolution • 1998, MQMAS is combined with DOR, Carr-Purcell, cross-pol., REDOR, VAS • 2000, STMAS cobines high single-quantum sensitivity wit high resolution • 2004, SPAM (soft pulse added mixing) increases sensitivity
Zeeman splitting of energy levels Neglecting quadrupole interaction, we have the pure Zeeman splitting Em = -g m B0 As an example, we consider the Zeeman splitting of a I=5/2-nucleus: m -5/2 -3/2 - 1/2 1/2 3/2 5/2 The right-hand side demonstrates level populations, which van be changed, e. g., by double frequency sweep (DFS). Double-headed arrows showsingle-quantum up to quintuple-quantum transitions.
Parameters of quadrupole interaction The quadrupole coupling constant Cqcc is commonly defined as where h denotes Planck's constant. Elements of the traceless tensor of the electric field gradient V are given in the principal axis system. The ZZ-component is VZZ = eq, where e denotes the elementary charge and the value q alone has no physical meaning in SI units. Q is the quadrupole moment. eQ is called the electric quadrupole moment. For the quadrupole frequency, Q, different definitions exist in the literature. We use where I denotes the nuclear spin. The asymmetry parameter is in the range 0 1. With the convention |VZZ| |VYY| |VXX| we obtain
z, z' y''' b z'', z''' y', y'' y a x x' g x''' x'' Euler's angles andthe angle-dependent quadrupole frequency n'Q A positive rotation to a frame (x, y, z) about the Euler angles includes the rotation about the original z axis, the rotation about the obtained y' axis, and the rotation about the final z" (identical with z''') axis.
Quadrupole shift of the Larmor frequency Assuming resonance offset and chemical shift to be zero, the quadrupole shift is given as m,m' = L. Conventions m,m+1 and m,m for single-quantum transitions and symmetric transitions, respectively, assign the central transition 1/2,+1/2 to m = 1/2. The first-order quadrupole shift becomes We see that there is no quadrupole shift for the central transition in first-order perturbation theory. Symmetric satellites appear around the central transition. But for all transitions a second-order quadrupole shift exist. It is for the central transition Note that the second-order quadrupole shift and broadening in powder spectra is proportional to (nQ/nL)2 , if expressed in ppm.
Zeeman first-order second-order wL +5/2+3/2 +3/2+1/2 +1/2–1/2 –1/2 –3/2 –3/2 –5/2 Quadrupolar shift for single crystals
rank 0 rank 4 I = 3/2, m* = ±1 2 8/9 I = 5/2, m* = ±1 1/8 7/24 I = 5/2, m* = ±2 7/2 11/6 I = 7/2, m* = ±1 2/5 28/45 I = 7/2, m* = ±2 7/5 23/45 I = 7/2, m* = ±3 -22/5 12/5 I = 9/2, m* = ±1 5/8 55/72 I = 9/2, m* = ±2 1/2 1/18 I = 9/2, m* = ±3 19/8 9/8 I = 9/2, m* = ±4 5 50/18 A useful different form of the equation Second-order quadrupole shift under MAS conditions can be written in a different form as rank 0 rank 4 Ratios on the left are the base of MAS satellite (SATRAS) and satellite transition (STMAS) spectroscopy. Table taken from Gan 2001: Ratios of expansion coefficients between satellite (m* - ½ m* + ½) and central transition (m* = 0).
static MAS h = 0 h = 0.5 h = 1 16 16 32 4 5 14 - - - - - 1 0 0 9 9 9 21 6 9 n - n L n 2 é ù 3 ( ) Q + - I I 1 ê ú n ë û 16 4 L Quadrupole line shapes for half-integeger spin I > ½ first-order, cut central transition second-order, central transition only h = 0 h = 1 I = 3/2 I = 5/2 I = 7/2 All presented simulated line shapes are slightly Gaussian broadened, in order to avoid singularities.n L is the Larmor frequency. spectral range: Q(2I 1) or 3 Cqcc/ 2I
Excitation, a broad line problem • Basic formula for the frequency spectrum of a rectangular pulse with the duration and the carrier frequency 0 with = 0: • We have a maximum f () = 1 for = 0 and the first nodes in the frequency spectrum occur at = 1/. The spectral energy density is proportional to the square of the rf field strength given above. If we define the usable bandwidth of excitation 1/2 in analogy to electronics as full width at half maximum of energy density, we obtain the bandwidth of excitation • It should be noted here that also the quality factor of the probe, Q = / probe, limits the bandwidth of excitation independently from the applied rf field strength or pulse duration. A superposition of the free induction decay (FID) of the NMR signals (liquid sample excited by a very short pulse) for some equidistant values of the resonance offset (without retuning the probe) shows easily the bandwidth probe of the probe.
Excitation profile of a rectangular pulse We denote the frequency offset by w. Positive and negative values of w are symmetric with respect to the4 carrier frequency w0 of the spectrometer. The rectangular pulse of the duration t has the frequency spectrum (voltage) The figure describes a pulse duration t = 1 µs. The first zero-crossings are shifted by 1 MHz with respect to the carrier frequency. Solid-state NMR spectrometer use pulse durations in the range t = 1 10 µs. Respectively, we have single-pulse excitation widths of 886 – 88.6 kHz. The full width at half maximum of the frequency spectrum correspond to a power decay to half of the maximum value or a voltage decay by 3 dB or by 0.707.
- 5 5 0 n / MHz - - 0 ,1 0,1 0,5 0,5 0 n / MHz Excitation profile of 2n + 1 pulses For example, NOESY and stimulated echo require 3 pulses. Than we have The figure on the left side corresponds to a pulse duration t = 1 µs and a symmetric pulse distance of 10 µs. Correspondingly, the first zero-crossings are shifted by 100 kHz with respect to the carrier frequency. The beat minima are shifted by 1 MHz.
-0,5 0,5 0 / MHz 21 subsequent 1-µs-pulses with 10 µs spacing The central excitation has a fwhm of 4 kHz, whereas we have had 30 kHz for three pulses. The excitation bandwith of the center band decreases with increasing number of pulses.
40 Hz -1 1 0 / kHz 21 subsequent 1-µs-pulses with 1 ms spacing The excitation band width of the center band decreases with increasing number of pulses and increasing pulse distance. Therefore, the excitation profile should be simulated in critical cases.
Selective excitation, a quadrupole problem • The intensity of the free induction decay G(t = 0) after the pulse with the radio frequency field strength rf and the duration is for nonselective excitation of all transitionsmm + 1 • The equation above gives also the relative intensities of all transitions, e. g. 12/30, 9/35 and 4/21 for the central lines in the case of nonselective excitation of the I = 3/2, 5/2 and 7/2 nuclei, respectively. The selective excitation of a single transition can be described by • Comparison of both equations reveals that the maximum observed intensity is reduced by , but, the effective nutation frequency is enhanced by the same value. For the central transition, m = 1/2, we obtain This is very important and should be discussed in detail on the table.
Highly resolved spectra of quadrupolar nuclei Motivation: • Resolution of signals having relatively small chemical shift differences • Determination of quadrupole parameters for resolved signals • Improvement of the sensitivity Simulated line shape of a central transition with an anisotropy factor h = 0.2 and slight Gaussian broadening; the static NMR spectrum without MAS, the MAS NMR spectrum for nrot > static linewidth, the rotation-synchronized MQMAS NMR spectrum. DOR spectrum looks like MQMAS spectrum, but many spinning side bands appear.
D t t t 1 2 5 4 3 2 1 p 0 - 1 - 2 - 3 - 4 - 5 MQMAS, the z-filter experiment The phase development for symmetric single and multiple-quantum transitions is described by p = 1 is the single-quantum central transition. p = 3 and 5 refer to triple- and quintuple- quantum transitions, respectively. d(4) denote Wiegner's reduced matrices of rank 4. Averaging of the anisotropic (rank 4) contributions in the echo after the time t2: two rectangular pulses+z-filter Election of coherence pathway is obtained by corresponding phase cycles.
Where we go? The preparation pulse creates coherences in all orders p 0. Of course, their intensity is drastically decreasing with the number of the order. How can we go a selected pathway? The transformation (spin density operator) of a coherence of sp at rotation around z-direction by the angle is described by A radio frequency pulse with the phase transfers at the time t coherences from the order p- to the order p+. In the following, t-and p- means before pulse, t+ and p+ means after pulse. Then we have Now we consider a quintuple-quantum experiment and set the phases of the first and third pulses and the receiver phase to 0°. But the phase of the second pulse is incremented in steps of (360/5)° starting from 0°. After five steps, we have five times accumulated the coherences p = +5 and p = -5, and averaged (to zero) other coherences; unfortunately, except the coherences p = 0 which were also five times accumulated. In order to quench the coherences p = 0, we increment ten times by (360/10)° and use an alternating receiver phases 0° and 180°. The signal for p = 0 is quenched after two scans with alternating receiver phases. After 10 scans we remain with the coherences p = 5 only. The pulse sequence has to be further prolonged, in order to include "cyclops" and to get real and imaginary part of the signal (after Fourier-transform in F2-direction) for the 2D-Fourier-transform in F1-direction.
3Q MAS t 3Q DFS t 3Q FAM II t +3 +2 +1 p = 0 - 1 - 2 - 3 Improved coherence transfer and whole-echo-split-t1 MQMAS techniques Kentgens introduced 1999 the double frequency sweeps in static, MAS and MQMAS NMR experiments on the basis of an amplitude modulation to the carrier frequency. The double frequency sweeps (DFS's) are generated by a programmed time-dependent amplitude modulation of the rf which causes two sidebands that are adiabatically swept from a start frequency to a final frequency during the pulsing. For 5QMAS split-t1-factors are 12/37 and 25/37. Echo occurs at t2=. The evolution time t1 is split between MQ and 1Q coherences. DFS means double frequency sweep, FAM denotes fast amplitude modulation. What is an adiabatic frequency sweep?
Adiabatic sweep for I = 5/2 Single crystal, no sample rotation, nQ’ = 300 kHz, z-axis of EFG and B0 coincide. The energy (m) is a function of the resonance offset in the rotating system (E = noffsetmh). In the frequency-stepped adiabatic half-passage (FSAHP) the spin system is far off-resonance at the beginning of the irradiation. The frequency is then stepped through the region of resonances slowly enough, that the density operator can follow the Hamiltonian. Switching off the rf power at the Larmor frequency creates a single-quantum coherence like a /2 pulse applied to a spin-1/2 system. A full passage would be comparable with a nonselective pulse. The figure inset shows the level repulsion at the crossing of the -1/2 and +1/2 levels. There is an energy gap of h nrf between the upper and lower branch
Optimization of pulse lengths MQMAS NMR pulse sequences require the adjustment of pulse lengths. It depends on the nuclear spin, on the order of multiple-quantum coherences, on the rotation frequency, on the nutation frequency and on the quadrupole parameters of the species under study. Pulse optimization by SIMPSON (Bak, Rasmussen, Nielsen) features an excellent agreement with the results of pulse optimization by NMR experiments. Both, SIMPSON optimization and the experiment show that the pulse optimization should focus on those species in the sample which have the largest quadrupole coupling constant. This leads to the lowest distortions of the quantitative character of the spectrum. Result of a SIMPSON-simulation of the first two pulses of a 3QMAS-split-t1 experiment for one of the27Al signals in the spectrum of the zeolite AlPO4-14 which has a quadrupole coupling constant of 4.08 MHz.
27Al 3QMAS NMR study of AlPO4-14 AlPO4-14, 27Al 3QMAS spectrum (split-t1-whole-echo, DFS pulse) measured at 17.6 T with a rotation frequency of 30 kHz. The parameters dCS, iso = 1.3 ppm, Cqcc = 2.57 MHz, h = 0.7 for aluminum nuclei at position 1, dCS, iso = 42.9 ppm, Cqcc = 1.74 MHz, h = 0.63, for aluminum nuclei at position 2, dCS, iso = 43.5 ppm, Cqcc = 4.08 MHz, h = 0.82, for aluminum nuclei at position 3, dCS, iso = 27.1 ppm, Cqcc = 5.58 MHz, h = 0.97, for aluminum nuclei at position 5, dCS, iso = -1.3 ppm, Cqcc = 2.57 MHz, h = 0.7 were taken from Fernandez et al.
Na-A MQMAS iso= 35.9 ppm = 45.0 ppm 24 MQMASiso / ppm = 46.4 ppm 32 60 2 / ppm 50 40 30 20 10 0 40 48 56 3 1 2 64 • 2 / ppm 60.0 50.0 40.0 30.0 20.0 10.0 68 51 34 17 0 / ppm 17O 3QMAS NMR and MAS NMR spectra of zeolite Na-A Two signals without shoulders are resolved in the isotropic projection of the 3Q MAS spectrum. This corresponds to three different SiOAl bond angles, which can be determined from the X-ray data of the hydrated zeolite Na‑A (Si/Al = 1). But three slices from the 2D spectrum were taken, see right side, since the existence of three sites was proved by the DOR spectrum. The deconvolution of the MAS spectrum (bottom right) uses the quadrupole parameters obtained by a simulation of the three anisotropic slices of the MQ MAS spectrum and gives finally the real intensities of three signals. The sheared 3Q MAS spectrum is presented with anisotropic projection on the top and isotropic projection on the side on the left hand side.
= 30.56° or 70.12° Double rotation (DOR) goes to zero for Double rotation was introduced by Samoson et al. in 1989. It averages the anisotropic contribution of the second-order quadrupole shift by fast sample spinning around the magic-angle (54.74°) and an angle of 30,56° or 70,12° in addition. This technique is based on an excellent fine mechanic and a computer controlled pneumatic unit.
DOR setup Iy/Ix has to be adjusted, in order to have J parallel to Z. νouter = 1-2 kHz, νinner = 5-10 kHz
DOR NMR spectra of the zeolite Na-A Three signals, one peak with shoulder and another well-resolved peak can be found in the DOR spectrum of zeolite Na-A in the field of 17.6 T. This corresponds to three different SiOAl bond angles. Intensities were obtained n a direct fit of the center line of the DOR spectrum under the assumption of equal envelope line shapes for the spinning sidebands of all species. The intensities ratio of ca.1:1:2 for sites O-1, O-2, O-3, respectively, is in good agreement with the relative occurrence of the SiOAl bond angles in the X-ray data.
MAS, MQMAS or DOR? Signal-to-noise ratios of AlPO4-14 and andalusite spectra. The ratios of the experimentally obtained spectra were recalculated, in order to base all values to the same acquisition time of 10 h. The acquisition time is the product of repetition time and number of scans for MAS and DOR, whereas for the 2D experiments the number of experiments is included. The numbers listed in the table show the large differences between the techniques. As example, we have for AlPO4-14 at 9.4 T the values 4740 and 56 for MAS and 5QMAS, respectively. It means that we need the (4740/56)2-fold acquisition time, in order to get an identical signal-to-noise ratio of the 5QMAS DFS spectrum compared to the MAS spectrum. It is well-known that 5QMAS takes the four-fold acquisition time as 3QMAS. The high signal-to-noise ratio of the DOR experiments compared with the 3QMAS techniques is remarkable. From this point of view, the combination of DOR with MAS and simulation of the MAS spectra seems to be the most effective procedure. Particularly for amorphous materials or other samples with a large distribution of isotropic values of the chemical shift, MQMAS experiments should be favored.
I acknowledge support from Özlen Erdem Horst Ernst Johanna Kanellopoulos Bernd Knorr Thomas LoeserDieter MichelLutz Moschkowitz Ulf Pingel Ekaterina Romanova Dagmar Prager Daniel ProchnowAgo Samoson Denis Schneider Deutsche Forschungsgemeinschaft Max-Buchner-Stiftung