Download
1 / 46
460 likes | 550 Views
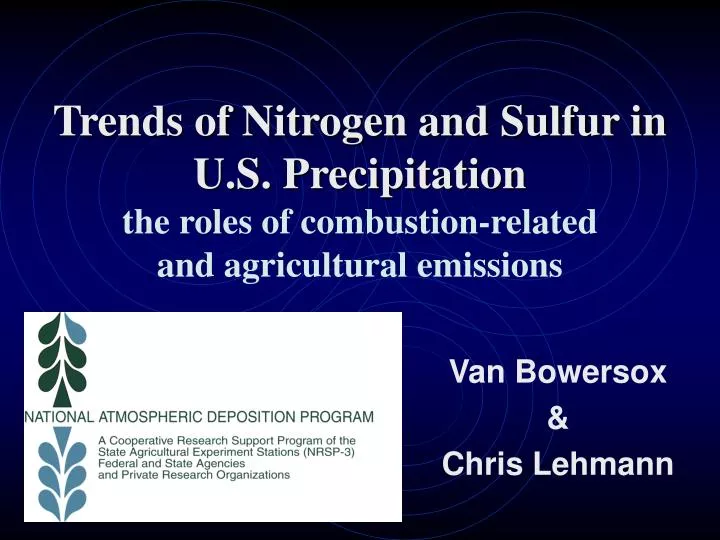
Trends of Nitrogen and Sulfur in U.S. Precipitation the roles of combustion-related and agricultural emissions. Van Bowersox & Chris Lehmann. `. 2002-39138-11964. NTN Sites – June 2006. NTN Sites – June 2006. 159 sites : 1985 – 2004 trends. 255 sites + 3 “precision” sites.

E N D
Trends of Nitrogen and Sulfur in U.S. Precipitationthe roles of combustion-related and agricultural emissions Van Bowersox & Chris Lehmann
` 2002-39138-11964
NTN Sites – June 2006 159 sites : 1985 – 2004 trends 255 sites + 3 “precision” sites
Sulfate Concentrations 1985 - 2003 84 85 86 87 88 89 90 91 92 93 94 95 96 97 98 99 00 01 02 03 04 National Atmospheric Deposition Program/National Trends Network
Sulfate Concentrations 1985 - 2003 84 85 86 87 88 89 90 91 92 93 94 95 96 97 98 99 00 01 02 03 04 National Atmospheric Deposition Program/National Trends Network
Evaluating Trends(See: Lehmann, Bowersox, & Larson. 2005.Environmental Pollution. 135: 347-361.) • Precipitation-weighted-mean (high-V class & low-V class) seasonal concentrations • Seasonal Kendall Trend Test • Null Hypotheses: • Trend is zero (no trend) • Trends are homogeneous (same in every season) • Significance Level • p ≤ 0.1 for trend significance • p > 0.1 for homogeneity • Trend magnitude by Sen's Median Estimator
NADP/NTN Sulfate Trend 1985-2004 NADP/NTN Sulfate Trend 1985-2004 The National Trend -46% (median change) The National Trend -46% (median change)
Total Emissions Measured // Modeled 1985-2004 SO2emissions SO2 emissions trend(p < .001) ▼38%44%52%▼ SO4 concentration trends ▼43%46%48%▼ Ag emissions of SO2< 0.5% of total Source: U.S. EPA
Nitrate Concentrations 1985 - 2003 84 85 86 87 88 89 90 91 92 93 94 95 96 97 98 99 00 01 02 03 04 National Atmospheric Deposition Program/National Trends Network
Nitrate Concentrations 1985 - 2003 84 85 86 87 88 89 90 91 92 93 94 95 96 97 98 99 00 01 02 03 04 National Atmospheric Deposition Program/National Trends Network
NADP/NTN Nitrate Trend 1985-2004 The National Trend -3% (median change)
Total Emissions Measured // Modeled NO2 emissions trend(p < .001) ▼12%20%27%▼ NO3 concentration trends ▼6%3%1%▲ Ag emissions of NO2< 3% of total Source: U.S. EPA
NOx Emissions Changes 1990-2000
??? 2000 - 1990 Emissions Differences • mismatch in time periods • undocumented emissions increases • changes in species scavenged (NH4NO3) 1985 to 2004 Trend Estimates
NADP/NTN Ammonium Concentrations 1985 - 2003 84 85 86 87 88 89 90 91 92 93 94 95 96 97 98 99 00 01 02 03 04 National Atmospheric Deposition Program/National Trends Network
NADP/NTN Ammonium Concentrations 1985 - 2003 84 85 86 87 88 89 90 91 92 93 94 95 96 97 98 99 00 01 02 03 04 National Atmospheric Deposition Program/National Trends Network
NADP/NTN Ammonium Concentrations 1985 - 2003 84 85 86 87 88 89 90 91 92 93 94 95 96 97 98 99 00 01 02 03 04 National Atmospheric Deposition Program/National Trends Network
NADP/NTN Ammonium Concentrations 1985 - 2003 84 85 86 87 88 89 90 91 92 93 94 95 96 97 98 99 00 01 02 03 04 National Atmospheric Deposition Program/National Trends Network
NADP/NTN Ammonium Concentrations 1985 - 2003 84 85 86 87 88 89 90 91 92 93 94 95 96 97 98 99 00 01 02 03 04 National Atmospheric Deposition Program/National Trends Network
NADP/NTN Ammonium Concentrations 1985 - 2003 84 85 86 87 88 89 90 91 92 93 94 95 96 97 98 99 00 01 02 03 04 National Atmospheric Deposition Program/National Trends Network
NADP/NTN Ammonium Concentrations 1985 - 2003 84 85 86 87 88 89 90 91 92 93 94 95 96 97 98 99 00 01 02 03 04 National Atmospheric Deposition Program/National Trends Network
NADP/NTN Ammonium Concentrations 1985 - 2003 84 85 86 87 88 89 90 91 92 93 94 95 96 97 98 99 00 01 02 03 04 National Atmospheric Deposition Program/National Trends Network
NADP/NTN Ammonium Concentrations 1985 - 2003 84 85 86 87 88 89 90 91 92 93 94 95 96 97 98 99 00 01 02 03 04 National Atmospheric Deposition Program/National Trends Network
NADP/NTN Ammonium Concentrations 1985 - 2003 84 85 86 87 88 89 90 91 92 93 94 95 96 97 98 99 00 01 02 03 04 National Atmospheric Deposition Program/National Trends Network
NADP/NTN Ammonium Concentrations 1985 - 2003 84 85 86 87 88 89 90 91 92 93 94 95 96 97 98 99 00 01 02 03 04 National Atmospheric Deposition Program/National Trends Network
NADP/NTN Ammonium Concentrations 1985 - 2003 84 85 86 87 88 89 90 91 92 93 94 95 96 97 98 99 00 01 02 03 04 National Atmospheric Deposition Program/National Trends Network
NADP/NTN Ammonium Concentrations 1985 - 2003 84 85 86 87 88 89 90 91 92 93 94 95 96 97 98 99 00 01 02 03 04 National Atmospheric Deposition Program/National Trends Network
NADP/NTN Ammonium Concentrations 1985 - 2003 84 85 86 87 88 89 90 91 92 93 94 95 96 97 98 99 00 01 02 03 04 National Atmospheric Deposition Program/National Trends Network
NADP/NTN Ammonium Concentrations 1985 - 2003 84 85 86 87 88 89 90 91 92 93 94 95 96 97 98 99 00 01 02 03 04 National Atmospheric Deposition Program/National Trends Network
NADP/NTN Ammonium Concentrations 1985 - 2003 84 85 86 87 88 89 90 91 92 93 94 95 96 97 98 99 00 01 02 03 04 National Atmospheric Deposition Program/National Trends Network
NADP/NTN Ammonium Concentrations 1985 - 2003 84 85 86 87 88 89 90 91 92 93 94 95 96 97 98 99 00 01 02 03 04 National Atmospheric Deposition Program/National Trends Network
NADP/NTN Ammonium Concentrations 1985 - 2003 84 85 86 87 88 89 90 91 92 93 94 95 96 97 98 99 00 01 02 03 04 National Atmospheric Deposition Program/National Trends Network
NADP/NTN Ammonium Concentrations 1985 - 2003 84 85 86 87 88 89 90 91 92 93 94 95 96 97 98 99 00 01 02 03 04 National Atmospheric Deposition Program/National Trends Network
NADP/NTN Ammonium Concentrations 1985 - 2003 84 85 86 87 88 89 90 91 92 93 94 95 96 97 98 99 00 01 02 03 04 National Atmospheric Deposition Program/National Trends Network
NADP/NTN Ammonium Trend 1985-2004 Ammonium Trend, 1985-2004 The National Trend + 30% (median change)
CMU w/ soils CMU w/o soils EPA method change Total Emissions Measured // Modeled Source: U.S. EPA
CMU-model Ammonia-N Emissions 2002 (includes soil emissions)
Sulfur // Nitrogen Chemistry: SO4/NH4/NH3/NO3/HNO3 • Inorganic SO4 has low volatility & reacts readily with NH3 to form stable salts compoundNH4/SO4 (NH4)2SO4 1.00 (NH4)3H(SO4)2 0.75 (NH4)HSO4 0.50 H2SO4 0.00 • Ammonia-rich environment: NH4/SO4>1.00 (Seinfeld, Saxena, Tanner, etal.)
Sulfur // Nitrogen Chemistry: SO4/NH4/NH3/NO3/HNO3 • NH4/NH3/NO3/HNO3 : distribution between aerosol (NH4NO3)& gas (NH3 & HNO3) phases depends on T, TD, PHNO3, PNH3 • Effects: • scavenging ratios • wet deposition // dry deposition • transport distances // atmospheric lifetimes • visibility
Based on a 20-year data record (1985-2004) at 159 NADP sites: • Significant trends of sulfur and nitrogen in U.S. precipitation. • SO4 decreased at ~97% (89% sig) of sites. Decreases ~ consistent with emissions • NH4 increased at ~90% (58% sig) of sites. NO3 decreased in NE and increased in MW & W. Need emissions and AQ data to evaluate S/R relationships. • Trends have resulted in increasingly ammonia-rich precipitation from which we infer a change in the particle // gas relationships of NH4, SO4, NO3, NH3, and HNO3
The NADP provides long-term high-quality data for studying chemical climate.