Download
1 / 6
60 likes | 197 Views
KEY CONCEPT Genes can be mapped to specific locations on chromosomes. Mutant. Wild type. Gene linkage was explained through fruit flies. . Morgan found that linked traits are on the same chromosome. Chromosomes, not genes, assort independently during meiosis.

E N D
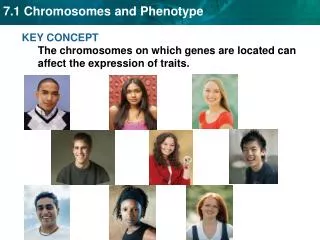
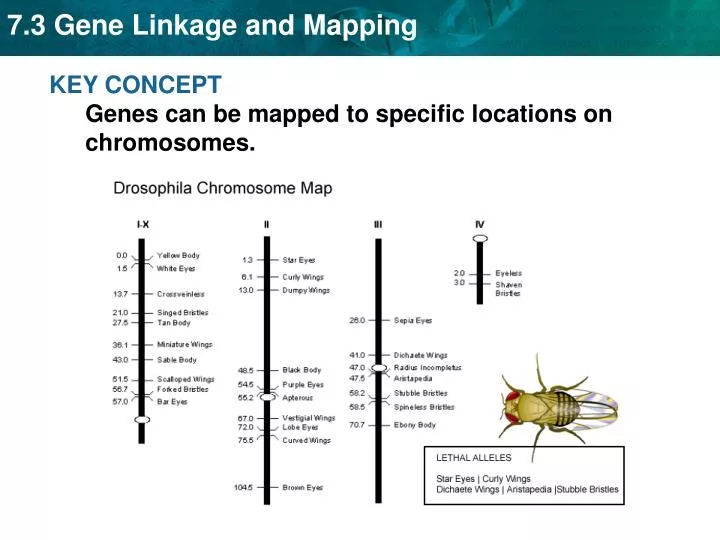
KEY CONCEPT Genes can be mapped to specific locations on chromosomes.
Mutant Wild type Gene linkage was explained through fruit flies. • Morgan found that linked traits are on the same chromosome. • Chromosomes, not genes, assort independently during meiosis.
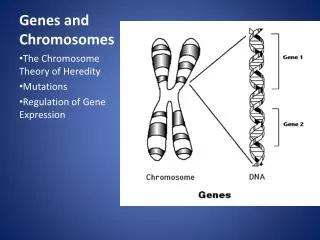
Chromosomes exchange homologous genes during meiosis. • Linked genes are not inherited together every time.
Linkage maps estimate distances between genes. • The closer together two genes are, the more likely they will be inherited together. • Cross-over frequencies are related to distances between genes. • The higher the frequency, the further the genes are apart • Linkage maps show the relative locations of genes.
Cross-over frequencies can be converted into map units. • Ex: A 5% cross-over frequency equals 5 map units. • gene A and gene B cross over 6.0 percent of the time • gene B and gene C cross over 12.5 percent of the time • gene A and gene C cross over 18.5 percent of the time
Draw a linkage map based on the following cross over percentages: • A – B = 8% • B – C = 10% • A – C = 2% 8.0 2.0 B A C 8.0 + 2.0 = 10.0