Download

1 / 15
150 likes | 160 Views
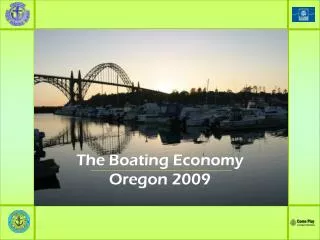
The Boating Economy Oregon 2009. Tough Times. Boating Trends. Sub Trends. Boat Use Days. Economic Trends. Tough Times…. Coastal Boating. Boat Use Days. Total Trips. Boat with installed heads are 25.5’ long. Operator is 61 years old. 50% more trips. 100% more days. Total Days.

E N D
Economic Trends • Tough Times…
Boat Use Days Total Trips • Boat with installed heads are 25.5’ long. • Operator is 61 years old. • 50% more trips. • 100% more days. Total Days
Population Changes Boat registrations declines: Clatsop 6.8%; Coos 7.7%; Curry 10.5%; Lincoln 5.4%; and Tillamook 4.9%. Boaters per 1000 residents declines: Clatsop 9.3%; Coos 8.2%; Curry 11.8%; Lincoln 5.9%; and Tillamook 8.2%.
CVA Funds $2 million Call Now!
BIG Program For big boats…
Economic Summary? Bright Side • Big water year • 3 Coho Limit • 1.2 million coho to Columbia • Low interest rates • Federal funds available • Resilient Boaters