Download
1 / 14
140 likes | 465 Views
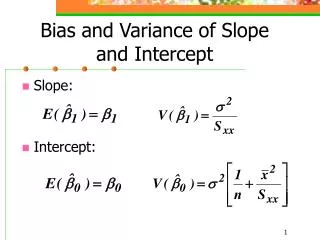
No Intercept Regression and Analysis of Variance. Example Data Set. Estimate two models. Model with y-intercept Y = a + b * X. Model no y-intercept Y = b * X. Observations. The model with a y-intercept is more complex than the model with no y-intercept.

E N D
Estimate two models • Model with y-interceptY = a + b * X • Model no y-interceptY = b * X
Observations • The model with a y-intercept is more complex than the model with no y-intercept. • One would expect then that the R2 of the model would decline when the y-intercept is removed. BUT, the R2 actually increases. • If the explanatory power of the model, R2, increases, then the error of the model, Standard Error, should decrease. But, the Standard Error actually increases.
Revision of Sum of Squaresfor no-intercept model This is re-calculated. These are from the model with a y-intercept.
Revised Statistics • Model no y-interceptY = b * X SSR / SST = 24.53 / 25.64 = 0.957 √ SSE / d.o.f. = √1.11 / 9 = 0.351
Comparison of Revised Statistics • Model with y-interceptY = a + b * X • Model no y-interceptY = b * X
Revised Observations • The model with a y-intercept is more complex than the model with no y-intercept. • One would expect then that the R2 of the model would decline when the y-intercept is removed. BUT, the R2 actually increases. • If the explanatory power of the model, R2, increases, then the error of the model, Standard Error, should decrease. But, the Standard Error actually increases. R2 decreases and the Standard Error increases. Explanatory power declines and error increases
Analysis of Variance Tablemodel no y-interceptREVISED SS / df FDIST (199.43, 1,9) MSR/ MSE
Summary • When comparing a model with a y-intercept to the same model without a y-intercept • Revise the ANOVA table for the no-intercept model with values from the y-intercept model (X). • Recalculate necessary items (Y), and the R2 and the Standard Error.