Download
1 / 25
300 likes | 636 Views
Design Build. Design Build. Customer employs design build company Defined new facility Specified completion date Agreed price. Straightforward Design Build Straightforward approach. QUANTITY SURVEYOR. ARCHITECT. OR. CUSTOMER. DESIGN BUILD COMPANY.

E N D
Design Build Customer employs design build company Defined new facility Specified completion date Agreed price
Straightforward Design BuildStraightforward approach QUANTITY SURVEYOR ARCHITECT OR CUSTOMER DESIGN BUILD COMPANY
Straightforward Design Build Scheme design approach SPECIALIST DESIGN CONSULTANT DESIGN CONSULTANT CUSTOMER GENERAL CONTRACTOR
Consultant Novation BRIEF & DESIGN CUSTOMER CONSULTANTS NOVATED GENERAL CONTRACTOR TRADE CONTRACTOR DESIGN CONSULTANT SPECIALIST DESIGN CONSULTANT
Develop and Construct CUSTOMER DESIGN CONSULTANT GENERAL CONTRACTOR SPECIALIST DESIGN CONSULTANTS SPECIALIST CONSULTANTS TRADE CONTRACTOR
Design Build - Key Relationships CUSTOMER DESIGN CONSULTANT GENERAL CONTRACTOR SPECIALIST DESIGN CONSULTANTS SPECIALIST CONSULTANTS TRADE CONTRACTOR BOUNDARYRELATIONSHIPS ESTABLISHED RELATIONSHIPS
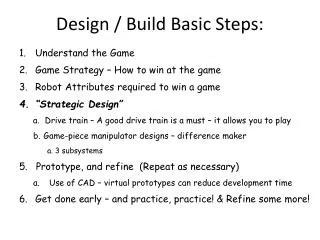
Project Process • Customer advised by consultants • Select design build company • Design team and management team • Single point of contact with customer • Brief, design and plan • Procurement, manufacture, produce and commission • Supervision by consultants
Design Build PerformanceCompletion on Time • Design build company involved at start of project: 78 % of projects completed on time or early • Design build company involved after scheme design produced: 70 % of projects completed on time or early • Design build company involved after design is substantially complete: 66 % of projects completed on time or early • Traditional construction: 56 % of projects completed on time or early
Design Build PerformanceCompletion within Budget • Design build company involved at start of project: 76 % of projects completed within 5% of the agreed budget • Design build company involved after scheme design produced: 69 % of projects completed within 5% of the agreed budget • Design build company involved after design is substantially complete: 90 % of projects completed within 5% of the agreed budget • Traditional construction: 68 % of projects completed within 5% of the agreed budget
Design Build PerformanceQuality Expectations • Design build company involved at start of project: 68 % of projects met customer’s quality expectations • Design build company involved after scheme design produced: 48 % of projects met customer’s quality expectations • Design build company involved after design is substantially complete: 38 % of projects met customer’s quality expectations • Traditional construction: 60 % of projects met customer’s quality expectations
Project using Design Build The project is to construct a new hotel on a virgin site. The hotel has 300 guest rooms and the other spaces expected in a 5* hotel The building is 10 stories high with a steel structural frame, concrete beam floors and roofs, and high quality, pre-fabricated external cladding.
Teams Team-days Brief 1 80 Design 14 560 Plan 2 150 Procurement 9 600 Manufacturing 5 150 Production 67 2820 Commissioning 7 140 TOTALS 105 4500
For a project with 105 teams (N=105) Possible relationships = 105 x 104/2 = 5460 3687 of these do not occur Actual relationships 5460 - 3687 = 1773
Largest number of teams in one time interval is 29 in 22nd and 32nd time interval They are constructing the external envelope, service cores, risers and main plant, the main entrance and vertical circulation Externally there is landscaping and external services are being installed The work is supervised by design build contractor’s plan and control teams 29 x 28/2 = 406 possible relationships
During the 32nd time interval the following teams work simultaneously 4 out of 6 external envelope teams 4 out of 6 service core teams 5 out of 5 risers and main plant teams 6 out of 12 entrance and vertical circulation teams 1 out of 1 contracts and payment systems teams 2 out of 3 design build contractor’s plan and control teams This gives a total of 22 teams with 231 relationships
Established Relationships Every team on a project has established relationships with at least one but often several other teams giving a total of 1128 established relationships Established Relationships Indicator ER=1128/1773=0.64
The relationship fluctuation indicator FE = 0.75 This reflects a strong influence of established relationships throughout the project because both ER and FE are comparatively high Design build companies may have established relationships with a significant number of other construction companies
Relationship Quality Indicator for established relationships ranges from 0.35 to 0.98 Total Relationship Quality Indicator 834/1773=0.47 Although there are a number of high values for individual Relationship Quality Indicators, the total Relationship Quality Indicator is only moderately good because the 1128 established relationships out of possible 1773 relationships are of moderate quality
The project organisation is not overly complex There are 34 time intervals out of a potential maximum of 209 The intervals are relatively short in comparison to total project duration (prevent escalation of problems when teams interact for a prolonged period) Relationships configuration complexity indicator = 0.87
The past performance of the 105 teams over their previous 10 projects provides team Performance Variability Indicators which range from 0.30 to 1.0 Performance Variability Indicator Rp=0.78
Historical records for projects using Design Build gives External Interference Indicator = 0.45
Project using Design Build Established Relationships ER=0.64 Relationship Fluctuation FE=0.75 Relationship Quality QR=0.47 Relationship Configuration CR=0.87 Performance Variability Rp=0.78 External Interference I=0.45
Efficient Design Build acts on the following propositions • Improve the quality of relationships • Reduce performance variability • Select teams competent in the technologies required by the project • Ensure teams accept the agreed objectives • Ensure teams are motivated to achieve agreed objectives • Foster accurate communications between teams