Download
1 / 10
100 likes | 213 Views
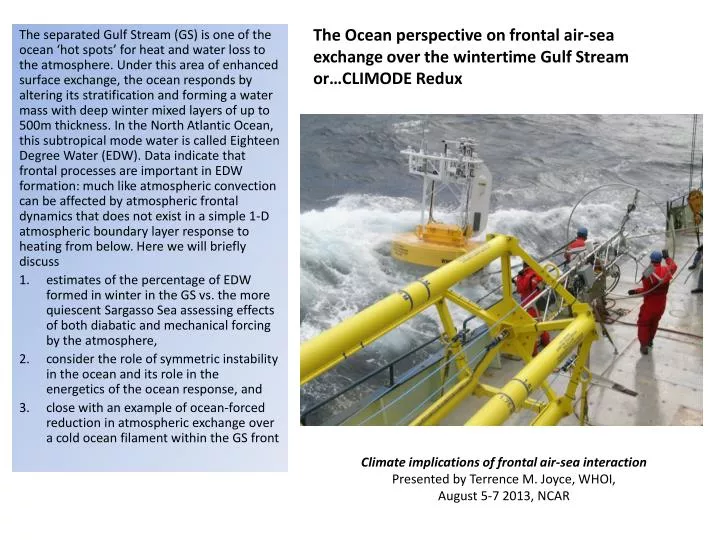
The Ocean perspective on frontal air-sea exchange over the wintertime Gulf Stream or…CLIMODE Redux.

E N D
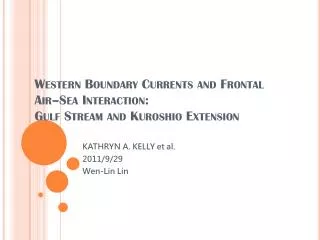
The Ocean perspective on frontal air-sea exchange over the wintertime Gulf Stream or…CLIMODE Redux The separated Gulf Stream (GS) is one of the ocean ‘hot spots’ for heat and water loss to the atmosphere. Under this area of enhanced surface exchange, the ocean responds by altering its stratification and forming a water mass with deep winter mixed layers of up to 500m thickness. In the North Atlantic Ocean, this subtropical mode water is called Eighteen Degree Water (EDW). Data indicate that frontal processes are important in EDW formation: much like atmospheric convection can be affected by atmospheric frontal dynamics that does not exist in a simple 1-D atmospheric boundary layer response to heating from below. Here we will briefly discuss estimates of the percentage of EDW formed in winter in the GS vs. the more quiescent Sargasso Sea assessing effects of both diabatic and mechanical forcing by the atmosphere, consider the role of symmetric instability in the ocean and its role in the energetics of the ocean response, and close with an example of ocean-forced reduction in atmospheric exchange over a cold ocean filament within the GS front Climate implications of frontal air-sea interaction Presented by Terrence M. Joyce, WHOI, August 5-7 2013, NCAR
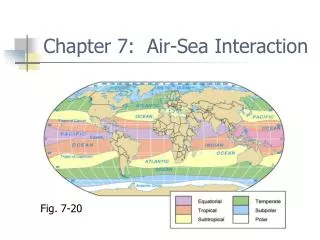
CLIMODE Feb/Mar surface means for 2007 In February- March 2007, the outcropping of EDW can be demarked by showing the SST contours of 17.5 & 18.5 oC. The surface front of the GS separates the cold subpolar and warmer subtropical waters, but also contains a warm SST anomaly which is advected (see geostrophic flow vectors) downstream. South of this warm water in the Sargasso Sea, isolated outcrops of newly ventilated EDW can be seen away from the GS front, while the EDW outcropping within the GS itself slowly emerges downstream until the two outcropping regions coalesce east of 55W. To the east of this point the strong GS flow shifts to lower temperatures and the EDW is ‘left behind’. New EDW in the two regions has slightly different properties (colder & fresher near the GS and downstream), but eventually becomes homogenized by the anticyclonic southern re-circulation gyre which lies between the GS and ca. 34N. EDW formation in the GS is examined from the Seasoar data (eg. red ladder pattern near 39N, 54W) EDW
Net heat and water exchange during winter (JFM) 2007 Surface heat (upper, positive into ocean) and water balance (evaporation – precipitation) from Joyce et al (DSRII 2013, adapted from Schanze et al 2010) underlay the composite of the meandering GS surface water, defined by the SST maximum advected downstream with the eastward surface flow until about 50W, when it disappears. The north wall (yellow or green dots) is a strong SST front while the south boundary (red or black dots) is weaker and eventually vanishes altogether. US Navy analysts routinely interpret SST imagery to define the two GS boundaries, which well define the region of maximum exchange with the atmospheric. Black contours in lower figure denote ±0.2 m/yr, which represent the uncertaintity of the zero contour.
Symmetric Instability in the wintertime Gulf Stream during CLIMODE Observational evidence of symmetric instability on two ClimodeSeasoar Surveys. On survey 3, line 3 (left panels) during weak diabatic cooling of the ocean, PV forcing due to winds and cooling are expressed in terms of heat flux units & down front winds account for >104 W/m2 cooling at the north wall of the GS, but there is a weaker region of equivalent ‘heating’ at the southern boundary of the warm core. Note strong negative PV anomaly in the upper 100m. During survey 2 (right panels), strong surface cooling and weak meanders within the near-homogeoeous EDW are reflected in the PV structure with PV anomalies following potential density surfaces. Within the surface BL (lower panels, black lines), PV<0 regions are due to static, symmetric, and shear instabilities, with shear being prominent (SI). From Thomas et al, DRSII, 2013. Observations and LES calculations suggest that APE→BI(KE) →SI(KE)→diss.+PE is an important energetics pathway in the wintertime Gulf Stream. EDW EDW
PV budget for Eighteen Degree Water [Marshall et al , JPO 2001, Olsina et al, DSRII 2013] Using a climatology of air-sea forcing for the period of 1988:2007 which includes the CLIMODE observational period of 2006 – 2007, surface PV forcing was based on OAFLUX climatologies (Yu et al, 2008) for wind, buoyancy flux, and Ekman depth, and two climatologies for mixed layer depth (MLD), which is perhaps the poorest known quantity. Following earlier work by Haines and McIntyre (1990) the Impermeability Theorem was applied in potential density space (modified to potential temperature space) and assesses PV flux in terms of monthly and mean annual forcing for the layer q=17:19 oC, which is associated with the subtropical mode water of the N. Atlantic called Eighteen Degree Water (EDW) by Worthington (1959). Wind induced PV forcing in the surface Ekman layer, De. This term efficiently extracts PV when surface ocean temperature is increasing to the right of the wind stress in the northern hemisphere. Buoyancy-induced PV forcing in the surface mixed layer, Dml. This term efficiently extracts PV when the net heat flux out of the ocean is positive in the northern hemisphere.
Wintertime (JFM) PV forcing of EDW can be diagnosed in terms of buoyancy and wind forcing. Using the monthly climatology of EDW PV forcing, the January-February-March period was selected when it is observed that large outcrops of newly-ventilated EDW are observed at the ocean surface in the Sargasso Sea and within the separated Gulf Stream (GS, Joyce et al, DSRII 2013). Our interest here is to estimate (1) how much of the EDW ‘formation’ occurs within the GS itself vs. the northern Sargasso Sea , and how important down-front wind stress is in this formation budget (Thomas, 2005). The monthly data product was provided by the Florida State group (Olsina et al, DSRII 2013) and averaged for JFM. A particular contour (200 W/m2 total PV forcing) was selected as defining the GS region (black contour lines, right) yielding: 42% of EDW formation is within the GS 40% of EDW formed in GS is due to down-front winds
Rapid Atmospheric BL adjustment – a case study in Climode due to a Cold SST filament - 1 LShW A close-up of the GS region near 53W reveals the meandering SST (colors, upper right) and ocean surface geostrophic velocity (vectors with amplitudes of ca. 1 m/s) and half-hourly positions of the R/V Knorr as she surveyed the frontal region from 15:17 March 2007.) A cold, fresh filament of Labrador Shelf Water (LShW, lower right), poorly resolved in the 1x1 degree SST imagery, was crossed multiple times, revealed by SST measurements with SSTs<10oC (upper, blue +’s). This filament, more than 300 km south of the Grand Banks of Newfoundland, was ‘insulating’ the underlying water from air-sea heat loss, and during this portion of the cruise heat flux was actually directed into the ocean. Note how rapidly the atmosphere adjusts to this SST filament at the 10m mast height of the vessel (middle panel).
Rapid Atmospheric BL adjustment – a case study in Climode due to a Cold SST filament - 2 W. Brown (UCAR) wbrown@ucar.edu On day 75, 16 March 2007, the R/V Knorr was carrying out a SeaSoar survey of the Gulf Stream region as shown on the previous figure. The winds were weak (<5-10 m/s) and out of the NE. As the vessel passed over a cold (lower right), fresh filament of LShW, the atmospheric boundary layer collapsed from a height of ca. 1 km to a few hundred m. Just prior to this, a radiosonde profile (below), taken at the dotted line in the upper right NCAR/RASS figure, revealed a complex layering of the atmosphere from the ocean surface to a height of 5 km.
Concluding remarks… LShW The complex layering of the atmosphere revealed in the RASS and radiosonde data from 15:17 March is reflected in the complexity of structure in the SeaSoar data from the last survey line taken on 17 March. Can we possibly sort out what is going on here? [more work required!] Mid-latitude ocean frontal structure both defines and is defined by the properties of the overlying atmosphere in winter. It influences the location of active air-sea exchange, synoptic storm tracks, and the properties of deep oceanic mixed layers formed just equatorward of the strong zonal ocean flows. These mixed layers or mode waters are themselves influenced by the air-sea heat loss and the down-front momentum exchange. Both the atmosphere and ocean have rich spatial scales characterized as sub-mesoscale, which we have only just started to explore! EDW GS EDW The LabradorShelfWater streamer was on the polewardside at the beginning of the third SeaSoar transect. The GS is denoted by the strong downstream flow (lower right) at the ‘origin of the section, which is oriented to be normal to the maximum flow direction. New DEW is found immediately south of the GS and under the re-established SST max of the GS, one can see some complpex layering in both Salinity (upper right) and Oxygen (lower left).