Download
1 / 24
240 likes | 343 Views
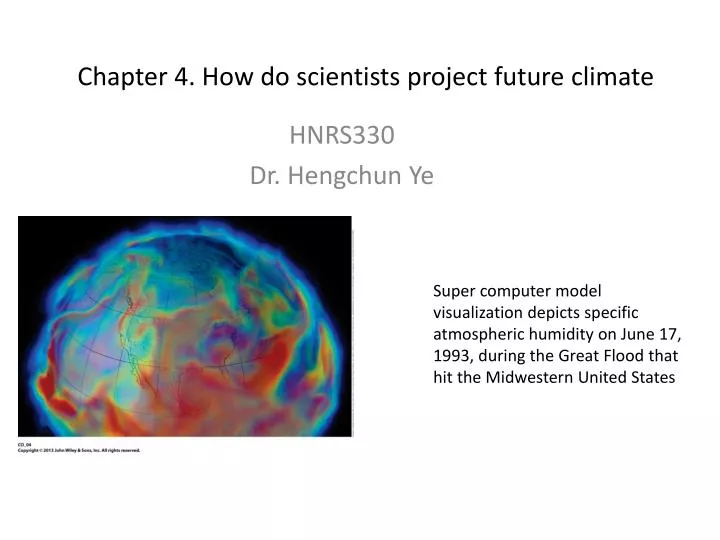
Chapter 4. How do scientists project future climate. Super computer model visualization depicts specific atmospheric humidity on June 17, 1993, during the Great Flood that hit the Midwestern United States . HNRS330 Dr. Hengchun Ye. Climate models.

E N D
Chapter 4. How do scientists project future climate Super computer model visualization depicts specific atmospheric humidity on June 17, 1993, during the Great Flood that hit the Midwestern United States HNRS330 Dr. Hengchun Ye
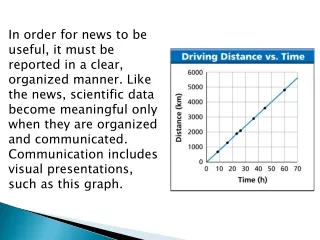
Climate models Global circulation Models (GCM): computer-based mathematical program that simulate the behavior and interaction of Earth’s ocean, land, and atmosphere. GCMs are used for weather forecasting, simulating climate, and predicting climate change. Models must take many factors into account such as how the atmosphere, the oceans, the land, ecosystems, ice, topography, and energy from the Sun all affect one another and Earth’s climate.
Input data: ocean currents and seawater temperature; the CO2, and other greenhouse gases; the amount of Sun light, the cover of vegetation, ice, and snow; The development of clouds, and other factors that affect the heating of earth’s surface. Climate models are designed to simulate climate on a range of scales from global to regional (100s KM).
GCMS (Fig 4.2) resolution: Spatial resolution: the size of grid cells-determine if it is specific to an area the size of US or New England or Manhattan. Temporal scale (model time):how often the model recalculates climate factors (every half hour, 6 hour, every week, etc.) Vertical layers: 10-30 layers between the earth’s surface and top of the atmosphere Modern models have 30 vertical layers, a few KM of grid cell. Problems: there are many processes that are smaller than a grid box: cloud formation, topography, precipitation, etc. Parameterization: the process of estimation for certain characteristics, for example cloudiness and rainfall can be estimated based on knowledge of the temperature and humidity in a grid box.
The probability of possible outcome is developed by running ensembles (groups) of GCMs, each uses different parameterizations and makes different types of assumptions. An Ensemble is a collection of model runs designed to identify the most probable future climate It requires 3 trillion computer calculations to simulate a single day of global climate. Regional climate model (RCM): finer resolutions for local regions using GCM’s parameters as boundary condition. Models do a good job of simulating air and ocean circulation, solar heating and the role of greenhouse gases. There are other factors that will influence climate: ENSO
ENSO: El Nino Southern Oscillation. A large-scale quasi-periodic meteorological pattern historically characterized by two conditions: La Nina and El Nino.
Global land-ocean T anomaly, global land and sea surface T, and El Nino index. (based period 1951-1980). Year-to-year global mean T variability largely correlated to the prevalence of El Nino and La Nina. Some T variability is dominated by large-scale volcanic emissions that tend to produce cooling of a year or two.
Fig 4.4 Impact of El Nino: Seasonal rains in Indonesia collapse, leading to drought, famine, and forest fires in southeast Asia, monsoon fails to onset. More rainfall on the coasts of both North and South America causing flooding and mudslides. Increased hurricane in Pacific Ocean but decreases in Atlantic ocean global warming may have caused more frequent El Nino Wind blowing to the west (Walker circulation) are weak during El Nino, and sea-surface temperature rise in the central and eastern Pacific
Explosive Volcanic Eruptions Fig 4.5 Sends thick columns of sulfuric compounds and ash into atmosphere. If they reach stratosphere, they scatter and absorb sunlight and temporarily offsetting warming with global cooling. Particles erupted into the stratosphere, which lacks rainfall and is dry, can remain for weeks to month. In some cases, massive eruptions can produce particles that circle the globe and cause global cooling for a year or more. Large amount of sulfur compounds can form a haze of tiny droplets of sulfuric acid, absorb and scatter sunlight a great deal. Eruption of Sarychev Peak, Kuril Islands (northeast of Japan), June 12, 2009; Photo taken from the International Space Station. Ash from the multi-day eruption has been detected 2,407KM east-southeast and 926 KM west-northwest of volcano, and commercial airline flights are being diverted away from the region to minimize the danger of engine failures from ask intake. Eruption column was measured at a height of more than 8km (5mi).
Fig 4.6 little Ice Age, a period of regional cooling in the North Atlantic , North America, and Europe that lasted hundreds of years may have been triggered by an unusual 50-year –long episode of four massive tropical volcanic eruptions between A.D.1275-1300 The Pinatubo eruption In 1991 increased aerosol optical depth (a measure of how much light airborne particles prevent from passing through a column of atmosphere) in the stratosphere by a factor of 10 to 100 times normal levels.
Fig 4.7 Ice-Albedo Feedback: Arctic ice reflects sunlight, as ice melt, less sunlight is reflected into space; more sunlight is absorbed into the oceans and land, raising the overall temperature and fuel further melting. (a) Arctic sea ice has been declining for at least 30 years. Lowest Arctic sea ice occurs in Sept. The ice extent in Sept 2012 was the lowest in satellite record, shrinking 18%.
Potentially Ice-free arctic summer Polar regions are the most sensitive areas to climate change on Earth. Resource exploitation such as oil drilling, fishing, sea floor dredging, can put at risk arctic ecosystems Human populations in the arctic depend on their ecosystems for their food and other basic needs. Rapid ecosystem change threatens the very survival of these human communities. Without options they become dependent on government support, displaced, and bereft of their traditional culture and identity. Ecosystem destruction anywhere on the planet reduces the diversity, interconnectedness, and complexity of living communities and thereby weakens the whole biological kingdom. Melting Greenland ice leads to global sea-level rise, the excessive melt water may be capable of slowing the thermohaline circulation
Greenland is the largest island in the world, it is covered by the ice left over from the last ice age (20,000-30,000 yrs ago when 27% global land is covered with ice; today is 10.4%). The map of changes in the % of light reflected by the ice sheet in summer 2011 compared to the average from 2000-2006. The entire surface ha grown darker owing to surface melting, dust and soot on the surface and temperature-driven changes in the size and shape of snow grains. The darker surface absorb more sunlight, accelerates melting. The largest melting occurred n summer 2012, huge amount of water flooded region and destroyed a major bridge built in 1970s. Ice lost in 2008 is 3 time the amount of lost in 2007. Resulting: rise sea levels; fresh water discharges potentially slow or shut down the thermohaline circulation by preventing the formation of deep water.
Conveyor belt hypothesis: A theory of rapid climate change. A shutdown of the thermohaline circulation could play a role in a negative climate feedback pattern beginning with ice melting that lead to glaciation. Too much fresh water make surface freeze (less salinity water is lighter and freezes at higher temperature) before it could become dense enough to sink towards bottom-Gulf stream would stop moving warm water northward, leaving Northern Europe cold and dry within a single decade. Since the last ice age (20,000-30,000 yrs ago), the warming trend was interrupted by cold spells at 17,500 and 12,800 yrs ago. These cold spells happened just after melting ice had diluted the salty north Atlantic water, slowing the ocean conveyor belt. (the Day After Tomorrow movie)
Clouds The roles of clouds: high albedo, reflect sunlight (Negative to energy balance) Absorb long wave radiation, similar to greenhouse gas effect (positive to energy balance) Which is more important to climate? Clouds during the day, air temperature? (increase or decrease) Clouds during the night, air temperature? High clouds tends to trap heat, positive impact Low clouds block the sunlight, negative feedback (as air temperature increases, more low clouds form) But not all scientists agree the ultimate role of clouds – cloud information is poorly represented in climate models.
Cloud Types and Identification High clouds: cirrus, cirrostratus, cirrocumulus Middle clouds: altostratus, altocumulus Low clouds: stratus, stratocumulus, nimbostratus Clouds with vertical development: Cumulus cumulonimbus
Solar Radiation Satellite ha not detected any increases in solar radiation in last 35 years. If solar radiation is responsible for warming, then entire atmosphere will warm and the following will be true (in contradict what observed however): Warming would be the same between equator and poles Warming would be the same between day and night Warming would be the same between winter and summer Total Sun Irradiance (TSI) has solar cycle, the rise and fall (about 11 years) of the sunspots on the sun’s surface. Sunspots are dark cool regions, but along the edge of a sunspot solar activity is high. Thus TSI is maximum when there are a high number of sunspots (0.1%; mostly in UV radiation, impact in stratosphere)
Impact of TSI Accounts for 15-20% of rainfall: increased P north of equator (South Asian Monsoon) and decreased P near the equator and at northern mid-latitudes, rises sea surface temperature where cloud cover is low. Simulation of 20 century climate. Sea level pressure, low level wind, sea surface temperature
GCMs of climate: Complex system: oceanographic, atmospheric, and terrestrial processes, individually depicted and interrelationship depicted, in the form of mathematical calculations; plus frequent but unpredictable processes such as ENSO, solar cycle, clouds, volcanism, ice albedo feedback, etc at different time scale and geographical location But they succeed in simulating last climate at largel scale!! It gives confidence in predicting future, but no guarantee of future success.
IPCC (2007)key findings Took 6 years to produce, 2,500 scientific expert, and more than 600 authors from more than 130 countries The warming trend over the last 50 years is nearly twice that for the last 100 years The average amount of water vapor in the atmosphere has increased since at least the 1980s over land and ocean. Since 1961, the average temperature of the global ocean down to depth of at least 3 KM (1.9 miles) has increased. The ocean has been absorbing more than 90% of the heat added to the climate system, causing seawater to expand and contributing to sea-level rise Global average sea level rose by 1.8mm (0.07 inches) per year from 1961-2003. Average arctic temperatures increased at twice the global average rate in the past 100 years Mountain glaciers and snow cover have declined on average in both hemispheres (contributing to sea level rise) Long term trends in amount of precipitation have been observed over many large regions from 1900-2005.
AR4: the Fourth Assessment Report on Climate Change released by IPCC. It is the benchmark study on which governments are basing development of new policies for counteracting the negative effects of global warming. Four scenarios were defined to project future climate change in GCMS A1. A future world of very rapid economic growth, global population that peaks in mid-century and declines thereafter, and the rapid introduction of new and more-efficient technologies A1F1. Energy is fossil-fuel intensive A1T. Energy is not fossil fuel intensive A1B. Energy does not rely too heavily on one particular source. A2. A future world that is characterized by self-reliance, preservation of local identities, and continuously increasing population. Economic growth and technological change are fragmented and slow. B1. A future world with a global population that peaks in mid-century and declines thereafter. The economy has a focus on service and information, with reductions in material intensity and the introduction of clean and resource efficient technologies aimed at achieving social and environmental sustainability B2. A future would with emphasis on local solutions to economic, social, and environmental sustainability. Global population continuously but slower than in other scenarios
Global average temperatures resulting from various greenhouse gas-emission scenarios. Shading denotes the uncertainty in the projection (plus or minus one standard deviation range of individual model annual average). The AR4 climate models predict that warming will be greatest in the Arctic and over land. These results vary depending on the level and type of future economic activity and the greenhouse gas production that results. P133 list of projected regional-scale patterns The modeling experiment found that a global warming of 3C (5.4F) by 2050 is equally plausible as rise of 1.4C (2.5F). The results suggest that the world is very likely to cross the “2 degree barrier’ at some point in this century if missions continues unabated. Thus planning for the impacts of climate change need to consider the possibility of warming of up to 3C (above 1961-1990 average) by 2050 even on a mi=range emissions scenario.
High-resolution predictions of climate on the scale of decades. It deconstructed recently observed surface temperatures into separate components caused by ENSO, volcanism, solar activity, and human influences in good accuracy and predict future 30 years. Modeled temperature in orange, observed in black. A volcanic eruption in 2014; B 2019 for strong ENSO (hypothesis) ENSO contribution in purple, volcanic eruption in blue, solar irradiance in green, greenhouse gas in red. Together, the four influence explain 76% of the variance of global mean air temperature observations.