Download
1 / 8
80 likes | 84 Views
SME Exchange: SME stands for Small, Micro & Medium Enterprise. An SME Exchange is a trading platform of a recognized stock exchange, with nationwide trading terminals authorised by SEBI to list securities (shares) of corporates from the MSME sector

E N D
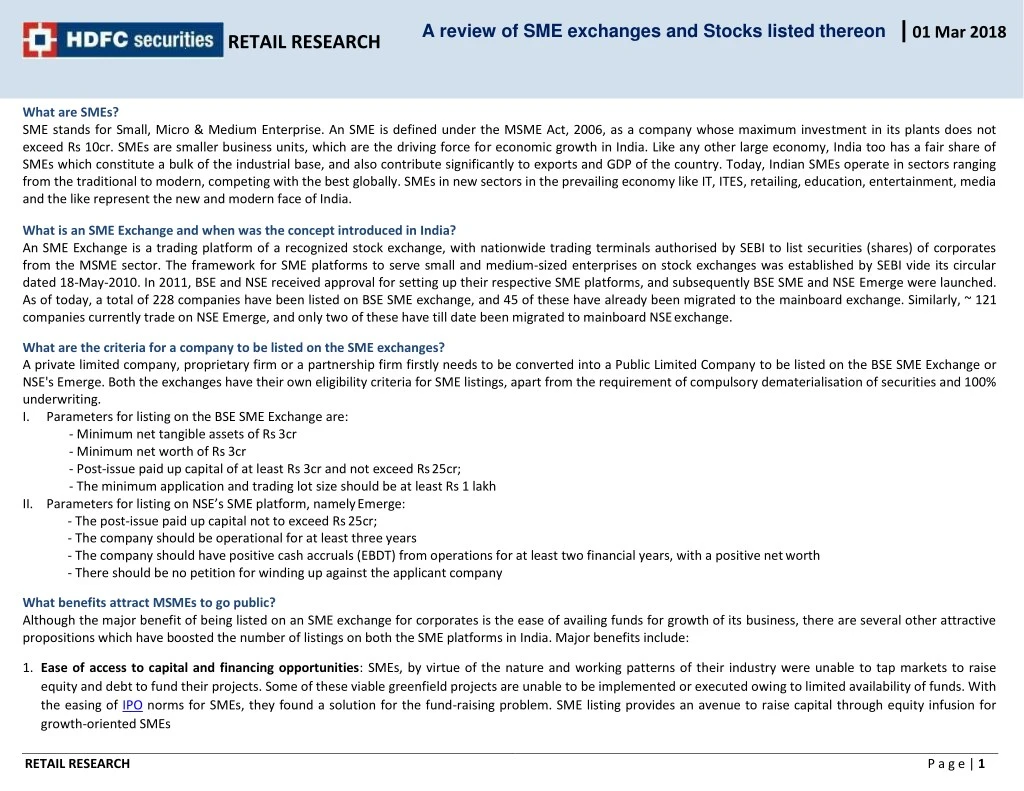
A review of SME exchanges and Stocks listed thereon 01 Mar 2018 RETAIL RESEARCH What are SMEs? SME stands for Small, Micro & Medium Enterprise. An SME is defined under the MSME Act, 2006, as a company whose maximum investment in its plants does not exceed Rs 10cr. SMEs are smaller business units, which are the driving force for economic growth in India. Like any other large economy, India too has a fair share of SMEs which constitute a bulk of the industrial base, and also contribute significantly to exports and GDP of the country. Today, Indian SMEs operate in sectors ranging from the traditional to modern, competing with the best globally. SMEs in new sectors in the prevailing economy like IT, ITES, retailing, education, entertainment, media and the like represent the new and modern face of India. What is an SME Exchange and when was the concept introduced in India? An SME Exchange is a trading platform of a recognized stock exchange, with nationwide trading terminals authorised by SEBI to list securities (shares) of corporates from the MSME sector. The framework for SME platforms to serve small and medium-sized enterprises on stock exchanges was established by SEBI vide its circular dated 18-May-2010. In 2011, BSE and NSE received approval for setting up their respective SME platforms, and subsequently BSE SME and NSE Emerge were launched. As of today, a total of 228 companies have been listed on BSE SME exchange, and 45 of these have already been migrated to the mainboard exchange. Similarly, ~ 121 companies currently trade on NSE Emerge, and only two of these have till date been migrated to mainboard NSE exchange. What are the criteria for a company to be listed on the SME exchanges? A private limited company, proprietary firm or a partnership firm firstly needs to be converted into a Public Limited Company to be listed on the BSE SME Exchange or NSE's Emerge. Both the exchanges have their own eligibility criteria for SME listings, apart from the requirement of compulsory dematerialisation of securities and 100% underwriting. I. Parameters for listing on the BSE SME Exchange are: -Minimum net tangible assets of Rs 3cr -Minimum net worth of Rs 3cr -Post-issue paid up capital of at least Rs 3cr and not exceed Rs 25cr; -The minimum application and trading lot size should be at least Rs 1 lakh II.Parameters for listing on NSE’s SME platform, namely Emerge: -The post-issue paid up capital not to exceed Rs 25cr; -The company should be operational for at least three years -The company should have positive cash accruals (EBDT) from operations for at least two financial years, with a positive net worth -There should be no petition for winding up against the applicant company What benefits attract MSMEs to go public? Although the major benefit of being listed on an SME exchange for corporates is the ease of availing funds for growth of its business, there are several other attractive propositions which have boosted the number of listings on both the SME platforms in India. Major benefits include: 1.Ease of access to capital and financing opportunities: SMEs, by virtue of the nature and working patterns of their industry were unable to tap markets to raise equity and debt to fund their projects. Some of these viable greenfield projects are unable to be implemented or executed owing to limited availability of funds. With the easing of IPO norms for SMEs, they found a solution for the fund-raising problem. SME listing provides an avenue to raise capital through equity infusion for growth-oriented SMEs RETAIL RESEARCH P a g e | 1
RETAIL RESEARCH 2.Sourcing debt also becomes easier: Listing gives recognition and a sense of safety to lenders owing to corporate governance requirements. This helps listed SMEs raise debt with ease. Further, listed securities can be collateralised by the promoter to secure loans which can be then be infused in the business. 3.Lesser regulatory controls: As against an IPO on the mainboard exchanges, an SME IPO has many relaxations in norms in terms of regulatory supervision and controls, both at the time of the launch of the IPO and on routine compliance under the listing agreement and regulations. 4.Enhanced visibility and credibility: Listing provides SMEs with the benefit of greater credibility and enhanced financial status, leading to higher valuation of the company on one hand, and improved customer-client credibility on the other. Even banks and financial institutions prefer to fund a listed SME as against an unlisted one. 5.Option for inorganic growth opens up: Equity financing provides growth opportunities like expansion, mergers and acquisitions, being cost-effective and tax- efficient mode. 6.Migration to mainboard helps the SME get rid of the SME tag: One of the major attractions of SME IPOs remains the provision of migration to the mainboard exchanges. Any company listed at the SME platform, after crossing the threshold of Rs 10cr capital may migrate to the mainboard exchange, and upon crossing the Rs 25cr threshold has to mandatorily migrate to the main exchange. These companies, however, need to be traded for a minimum period of two years on the SME platforms before they can migrate to the mainboard 7.Market making requirements: The merchant bankers to the issue will undertake market making through a stock broker who is registered as a market maker with the SME exchange. The merchant bankers shall be responsible for market making for a minimum period of three years. The market makers are required to provide a two-way quote for 75% of the time in a day. There will not be more than 5 market-makers for a scrip. The exchange shall prescribe the minimum spread between the bid and ask price. During the compulsory market-making period, the promoter holding shall not be eligible in the offering to market makers. These regulations give SMEs an edge, and induce investors to participate in such stock trading and increase the liquidity of the stock. Despite this requirement, there is no trade on some days in about 20-25% of stocks listed on SME exchange. What does migration from SME exchange to mainboard exchange mean? What is the eligibility criteria for migration? What are its benefits? On meeting the requisite criteria and receiving an application, the trading of shares is shifted from the SME exchange (BSE SME / NSE Emerge) to the mainboard exchange (BSE / NSE). The eligibility criteria for migration of shares is as follows: 1.To move up to the mainboard, the SME exchange companies have to ensure that their paid-up capital exceeds Rs 10cr, but is below Rs 25cr. In this case however, a special resolution is to be passed, wherein non-promoter shareholders should consent with 2/3rd majority or, 2.In cases where the post-issue paid-up capital is likely to exceed Rs 25cr, the SME exchange companies shall migrate to the mainboard. The major benefit of this migration is to come into the limelight and get a recognition of being listed on the mainboard exchange. Upon migration, we have observed that trading volumes fall, but the risk of a drastic fall in share price owing to continuous selling pressure recedes. Further, retail investors can now participate in investment of such shares as the lot size requirement (of >Rs.1 lakh) is no longer applicable, and the per-transaction value comes down. The table below provides us with a view on the stocks that have migrated to the mainboard till date, and how they have performed post migration. The returns here are CAGR and absolute, and portray that 27 of the 45 stocks migrated have given compounded positive returns post migration, and ~30 of the 45 stocks have given an overall compounded positive return since being listed on the SME exchange. RETAIL RESEARCH P a g e | 2
RETAIL RESEARCH CMP as on 27- 02-2018 393.00 301.90 666.55 147.70 352.00 476.95 162.15 130.65 212.00 135.20 209.90 Return Post Migration (Abs) Total Return (Abs) Return Post Migration (CAGR) Total Return (CAGR) Annualized Total Income Rs Cr Annualized PAT Rs Cr Name of scrip Suyog Telematics Ltd SRG Housing Finance Ltd Vishal Fabrics Ltd Oceanaa Biotek industries Ltd Gala Global Products Ltd Ashapura Intimates Fashion Ltd B.C. Power Controls Ltd Dhabriya Polywood Ltd Rudra Global Infra Products Ltd Jiya Eco-Products Ltd Ceinsys Tech Ltd Atishay Ltd Captain Polyplast Ltd RCI Industries & Technologies Ltd Kushal Ltd Veto Switchgears & Cables Ltd Jupiter Infomedia Ltd Oasis Tradelink Ltd AGI Infra Ltd Akme Star Housing Finance Ltd India Finsec Ltd Vibrant Global Capital Limited Tiger Logistics (India) Ltd Karnavati Finance Ltd Ultracab (India) Ltd Mishka Exim Ltd Sanco Industries Ltd Sangam Advisors Ltd Chemtech Industrial Valves Ltd Comfort Commotrade Ltd Aanchal Ispat Ltd Anubhav Infrastructure Ltd Silverpoint Infratech Ltd Funny Software Ltd VCU Data Management Ltd Looks Health Services Ltd Amsons Apparels Ltd Sunstar Realty Development Ltd Lakhotia Polyesters (India) Ltd Satkar Finlease Ltd -21% 383% 163% 463% 103% 84% 66% -22% 18% 50% -4% 8% 144% 3% 435% 208% 226% 20% 32% 108% 441% 13% 34% 79% -32% -18% -64% 221% 16% -3% 25% -18% 7% -53% -21% -5% -56% -86% 4% 52% 1472% 1410% 1381% 1377% 1367% 1092% 801% 771% 685% 612% 425% 424% 403% 360% 359% 350% 301% 260% 256% 250% 245% 242% 222% 204% 154% 150% 110% 63% 28% 16% -13% -40% -46% -50% -52% -59% -63% -67% -75% -81% -19% 67% 3729% 350% 943% 25% 491% -26% 104% 248303% -25% 96% 64% 115% 99% 179% 66% 74% 90% 119% 111% 64% 63% 47% 45% 40% 33% 28% 42% 54% 53% 30% 44% 30% 44% 32% 42% 21% 9% 6% 3% -4% -15% -13% -22% -15% -14% -27% -20% -25% -32% 84.9 30.3 851.4 51.7 70.7 321.9 377.7 134.8 8.0 79.8 124.2 20.2 126.4 2,166.4 2,981.1 245.2 20.9 8.0 19.6 7.9 2.4 64.9 3.1 7.1 -0.2 9.2 2.9 1.9 5.5 35.9 171.1 29.1 1.0 5.4 12.4 3.1 0.9 0.5 8.6 0.8 0.9 -0.3 4.1 0.5 -2.3 4.1 1.1 0.0 -0.1 0.1 1.4 0.4 0.0 0.8 0.0 0.0 83.85 150.75 183.90 160.60 225.05 80.10 107.85 192.00 105.05 34.50 65.05 212.65 30.40 91.50 25.00 37.85 35.95 19.20 11.56 17.35 9.03 8.06 6.96 12.12 16.45 3.69 6.61 8.76 3.34 7% 55% 2% 107% 49% 54% 19% 1769% 203% 104% 51799% 16% 186% -29% -49% -56% 51% 77% -2% 36% -22% 1.8 494.1 113.5 6.2 6.4 7.5 294.9 1.6 49.7 10.8 146.4 1.5 56.8 105.0 409.2 0.7 0.5 1.4 6.4 2.2 2.9 2.5 18.8 0.7 3% -71% -22% -3% -62% -97% 2% 23% RETAIL RESEARCH P a g e | 3
RETAIL RESEARCH Kavita Fabrics Ltd eDynamics Solutions Ltd VKJ Infradevelopers Ltd Bronze Infra-Tech Ltd Anshu's clothing Ltd 7.10 3.00 1.48 0.85 1.39 -10% -49% -53% -98% -69% -82% -88% -94% -94% -95% -4% -27% -30% -72% -32% -29% -36% -47% -42% -42% 5.2 1.3 4.1 0.6 2.4 0.1 0.1 0.1 -0.0 -11.0 (Source: Capitaline, HDFCSec) How do investors benefit from SME exchanges? Where do they need to be careful? SME exchanges not only enable small businesses to raise funds with ease, but also allow the risk-seeking investors to take calculated calls on businesses they feel can grow enough to satiate their return requirements. Key attractions for the investors would include the following: 1.Easier liquidity and exit: Through SME exchanges, PE investors can easily enter and exit their investments. Seed stage is when funds are most required for any business, and that is when the PE investors step in. However, one of the concerns regarding such an investment is the absence of the possibility to liquidate investments whenever desired. Such investments generate superior returns, but include additional risks of liquidity and volatility (due to circuit limits, large lot size and limited depth on certain days). Listing would provide liquidity to shareholders, and at the same time, would offer exit options to venture capital and private equity investors. 2.Tax benefits: It is known to all investors that the tax benefit entailed in a transaction involving exchange-traded securities is higher than the unlisted securities. Although the benefit of 0% taxation on long-term capital gains has been withdrawn as per the proposal made in Budget 2018, the benefit for STT paid exchange- traded securities prevails. The long-term capital gains are taxed at 10%, whereas the short-term capital gains are taxed at 15% for STT-paid securities, as against the normal 20% for long-term and 30% for short-term gains. 3.Well managed companies can deliver superior returns: A good corporate governance-bearing company can reward investors in this segment for the risks taken. Small capex can yield high growth organically for such companies. Also, at times, a small but strongly positioned player may fetch premium valuations for buyouts and may deliver good returns to patient investors. 4.Tax benefits to flow in for smaller players: SME business with revenues <Rs 250cr would benefit from the concessional tax rate announced in the current year’s budget. This can draw higher investment in such small businesses from various groups of investors looking to benefit from this concessional tax rate. 5.Average number of shareholders in all SME companies is ~265, while the median number is ~185. This low number has its own implication on liquidity, volatility, and depth, which in turn affect the impact costs on entry/exit of a large number of shares. 6.Regulatory requirements: As compared to the listing/compliance norms for a mainboard listed company, a SME company has to face lower levels of regulations. Key differences include the minimum number of subscribers (50 in SME vs 1000 in mainboard), IPO underwriting (Mandatory with minimum 15% subscription by merchant banker in SME vs non-mandatory in mainboard), offer document vetting (by exchange in SME vs SEBI in mainboard), result declaration (bi-annually in SME vs quarterly in mainboard). However absence of regular disclosures could result in a lopsided awareness of the company’s current businesses and prospects impacting minority shareholders’ interest at times. Which are the companies to track from the currently listed SMEs? It would be unfair to make a list based on a single criteria. In view of the same, we have formulated and presented the following tables: 1.Qualified Institutional Buyers’ interest w.r.t. any initial offering instills confidence in such company and the industry to which it belongs. The following table enlists the companies whose IPOs attracted QIBs and also lists down the current QIP holdings in such companies. The list further contains companies which initially missed QIB’s radar but later the QIB’s bought/upped their stake in said companies. RETAIL RESEARCH P a g e | 4
RETAIL RESEARCH Sr No 1 2 3 4 5 6 7 8 9 10 11 12 13 14 15 16 17 18 19 20 21 22 23 24 25 26 27 28 29 30 31 32 33 34 35 36 37 38 39 40 41 Company Name Industry QIB Subscription Institutional Holding (%) Listing Date Mitcon Consultancy & Engineering Services Ltd Opal Luxury Time Products Ltd Jash Engineering Ltd Thejo Engineering Ltd Shanti Educational Initiatives Ltd Max Alert Systems Ltd Vaksons Automobiles Ltd HEC Infra Projects Ltd Perfect Infraengineers Ltd SSPN Finance Ltd InfoBeans Technologies Ltd Anisha Impex Ltd Momai Apparels Ltd Worth Peripherals Ltd CMM Infraprojects Ltd Globalspace Technologies Ltd Bohra Industries Ltd Manav Infra Projects Ltd Valiant Organics Ltd Tejnaksh Healthcare Ltd Prime Customer Services Ltd CHD Chemicals Ltd Chemtech Industrial Valves Ltd Ajooni Biotech Ltd Sanghvi Brands Ltd Lexus Granito (India) Ltd Cadsys (India) Ltd Majestic Research Services & Solutions Ltd JLA Infraville Shoppers Ltd SKS Textiles Ltd Jointeca Education Solutions Ltd B.C. Power Controls Ltd SVP Housing Ltd SecUR Credentials Ltd Steel City Securities Ltd RKEC Projects Ltd Globe International Carriers Ltd Jhandewalas Foods Ltd RCL Retail Ltd ICE Make Refrigeration Ltd SMVD Poly Pack Ltd Miscellaneous Miscellaneous Engineering Engineering Miscellaneous Miscellaneous Trading Construction Engineering Finance & Investments Computers - Software Trading Textiles - Products Paper Construction Computers - Software Fertilizers Construction Chemicals Healthcare Trading Trading Trading Miscellaneous Miscellaneous Ceramics - Tiles Computers - Software Miscellaneous Trading Textiles - Products Computers - Software Cables - Power Construction Miscellaneous Finance & Investments Construction Miscellaneous Food - Processing Food - Processing - Indian Engineering Plastics Products 0.0 1.2 2.5 0.0 0.0 0.0 0.0 0.0 0.0 0.0 0.0 0.0 0.0 21.1 4.3 0.0 0.0 0.0 0.0 0.0 1.0 0.0 1.2 4.1 3.5 2.7 3.6 1.0 0.0 3.6 0.0 2.1 0.2 1.8 0.0 2.5 0.0 21.7 0.0 17.6 2.8 37.1 28.4 16.1 13.7 12.8 12.1 10.0 7.6 6.7 6.7 6.3 5.4 4.9 4.1 3.5 3.4 3.1 2.5 2.1 1.8 1.6 1.4 1.1 1.0 1.0 0.9 0.9 0.4 0.4 0.3 0.3 0.3 0.2 0.2 0.2 0.1 0.1 0.1 0.1 0.0 0.0 01-11-2013 12-04-2013 11-10-2017 18-09-2012 14-06-2016 13-07-2012 16-10-2015 30-03-2016 20-11-2015 26-03-2015 02-05-2017 18-03-2014 16-10-2014 27-09-2017 12-10-2017 07-08-2017 05-04-2017 18-09-2017 14-10-2016 27-10-2015 31-03-2017 01-04-2016 31-01-2014 02-01-2018 22-11-2017 23-08-2017 04-10-2017 14-12-2016 12-11-2014 19-01-2018 04-09-2012 14-03-2014 27-03-2015 13-11-2017 17-02-2017 09-10-2017 19-10-2016 12-01-2018 16-10-2012 08-12-2017 26-12-2017 RETAIL RESEARCH P a g e | 5
RETAIL RESEARCH ANI Integrated Services Ltd Chemcrux Enterprises Ltd Total Transport Systems Ltd Super Fine Knitters Ltd Surevin BPO Services Ltd DRA Consultants Ltd Commercial Syn Bags Ltd Vasa Retail and Overseas Ltd RMC Switchgears Ltd Vidli Restaurants Ltd Manas Properties Ltd Transwind Infrastructures Ltd Beta Drugs Ltd Ambition Mica Ltd OFS Technologies Ltd IRIS Business Services Ltd Rithwik Facility Management Services Ltd Geekay Wires Ltd R J Bio-Tech Ltd Kaarya Facilities & Services Ltd Women's Next Loungeries Ltd Manomay Tex India Ltd Trident Texofab Ltd Institutional holding is as per latest half year or post allotment disclosure whichever is later. 42 43 44 45 46 47 48 49 50 51 52 53 54 55 56 57 58 59 60 61 62 63 64 Engineering - Turnkey Chemicals Miscellaneous Textiles - Products Computers - Software Miscellaneous Packaging Printing & Stationery Electric Equipment Hotels Construction Engineering - Turnkey Pharmaceuticals Miscellaneous Computers - Software Computers - Software Miscellaneous Cables - Power Miscellaneous Miscellaneous Textiles - Products Textiles - Products Trading 5.5 27.8 21.8 12.7 7.2 6.6 5.6 5.2 5.1 3.6 2.7 2.7 2.4 2.1 1.9 1.8 1.7 1.6 1.5 1.3 1.2 1.2 1.1 0.0 0.0 0.0 0.0 0.0 0.0 0.0 0.0 0.0 0.0 0.0 0.0 0.0 0.0 0.0 0.0 0.0 0.0 0.0 0.0 0.0 0.0 0.0 20-11-2017 28-03-2017 07-08-2017 02-02-2017 09-08-2017 13-10-2016 14-07-2016 06-02-2018 14-03-2017 15-02-2016 30-03-2017 12-07-2017 12-10-2017 29-11-2017 14-01-2016 11-10-2017 11-01-2018 24-08-2017 25-09-2013 27-10-2017 21-04-2014 28-03-2017 05-10-2017 (Source: Capitaline, HDFCSec) 2.Companies having annualized revenues higher than Rs 70cr, PAT higher than Rs 2cr and minimum PAT margin of 2%, promoter holding of more than 50%, etc. are some of the key fundamental checks for SMEs. Apart from we have ignored companies from industries like EPC, Infra business, Trading, Jewelry business, etc. whose profitability may be affected easily with changing business environment. We have considered all of above and produce following list of companies which can be tracked: Name Industry (FY17 / FY18E annualized) annualized) Aarvi Encon Ltd Maint. Services 153.2 9.7 ANI Integrated Services Plastic Products 62.8 12.9 Bajaj Healthcare Ltd Capital goods 297.6 35.7 Bella Casa Fashion Auto Ancillary 139.7 13.4 Beta Drugs Ltd Textiles 41.7 7.2 Bohra Industries Ltd Distributor 102.0 15.7 Captain Polyplast Ltd Financial Services 106.3 13.9 Annual Revenues Annual OP Profit (FY17 / FY18E Annual PAT (FY17 / FY18E annualized) CMP as on 27- 02-2018 Rs Mcap as on 27-2- 2018 Rs Cr Book Value Rs PAT Margin DE Ratio Promoter Holding OPM P/E 5.3 7.9 11.2 6.2 5.2 4.8 4.5 6.3% 20.5% 12.0% 9.6% 17.4% 15.4% 13.1% 3.5% 12.5% 3.8% 4.4% 12.4% 4.7% 4.2% 38.3 32.1 83.3 22.0 34.5 49.2 30.3 0.4 0.4 1.5 2.0 1.7 1.1 0.9 73.4% 70.9% 67.3% 73.3% 68.9% 61.2% 74.5% 98.00 125.00 385.00 202.00 148.00 33.10 150.75 144.9 121.1 265.6 202.1 128.0 50.5 151.9 27.2 15.4 23.6 32.6 24.7 10.5 34.1 RETAIL RESEARCH P a g e | 6
RETAIL RESEARCH Commercial Syn Bags Ltd CRP Risk Management Ltd D P Wires Ltd Dynamic Cables Ltd Emkay Taps & Cutting Focus Lighting & Fixtures Ltd Global Education Ltd ICE Make Refrigeration Ltd InfoBeans Technologies Ltd Innovative Tyres & Tubes Ltd Jalan Transolutions Jash Engineering Ltd Khemani Distributors Kwality Pharmaceuticals Ltd Majestic Res. Serv. Nitiraj Engineers Ltd One Point One Solutions Ltd Pashupati Cotspin Ltd Radhika Jeweltech Ltd Sarthak Metals Ltd Servotech Power Systems Ltd Shanti Overseas (India) Ltd Share India Securities Ltd Silver Touch Technologies Ltd Steel City Securities Ltd Sysco Industries Ltd Thejo Engineering Ltd Total Transport Systems Ltd Universal Autofoundry Ltd Valiant Organics Ltd Wealth First Port. Man. Ltd Worth Peripherals Ltd Zota Health Care Ltd Annual numbers are in Rs Cr Containers Pharma Containers Pharma Jewellery Pharma KPO Broking Education Electronics Iron wires Fertilizers Electricals IT Pharma Transportation Agro products Logistics Capital goods Textiles Containers Manpower outs. Steel wires Tyres Broking Capital Goods Pharma Manpower Outs. IT Cooling solution Wires BPO BPO 159.1 81.0 196.1 300.0 49.5 81.0 32.1 87.9 88.5 132.2 125.9 158.0 73.8 121.7 40.1 37.8 95.8 221.1 212.3 149.2 59.2 137.0 110.1 123.0 54.6 143.4 223.3 207.5 79.8 68.0 114.1 149.4 78.3 14.2 12.6 11.1 23.3 22.9 11.3 12.9 10.7 20.1 14.4 26.6 24.4 8.0 13.3 14.9 6.8 16.1 24.5 15.7 10.6 9.9 6.1 17.4 13.5 15.1 18.4 26.3 7.8 7.4 20.5 11.3 21.1 13.2 5.1 5.1 5.0 7.9 14.5 7.4 7.9 5.1 15.5 4.1 5.4 10.1 7.1 5.8 9.0 4.0 6.3 7.8 15.3 6.1 4.7 3.5 8.0 4.1 9.0 4.0 9.7 4.9 1.8 12.4 9.5 11.4 8.0 8.9% 15.6% 5.7% 7.8% 46.3% 13.9% 40.2% 12.2% 22.7% 10.9% 21.1% 15.4% 10.8% 10.9% 37.1% 18.0% 16.8% 11.1% 7.4% 7.1% 16.7% 4.4% 15.8% 11.0% 27.6% 12.8% 11.8% 3.8% 9.2% 30.2% 9.9% 14.1% 16.9% 3.2% 6.2% 2.5% 2.6% 29.3% 9.1% 24.6% 5.8% 17.5% 3.1% 4.3% 6.4% 9.7% 4.8% 22.5% 10.6% 6.5% 3.5% 7.2% 4.1% 8.0% 2.6% 7.3% 3.3% 16.5% 2.8% 4.4% 2.4% 2.3% 18.2% 8.3% 7.6% 10.3% 35.1 31.3 40.3 29.4 474.9 46.7 79.5 25.0 32.7 41.2 24.9 93.7 27.7 23.9 20.9 94.4 40.0 57.0 45.1 23.9 16.4 21.1 23.6 42.6 56.1 41.6 163.1 22.2 17.3 79.8 30.6 37.4 33.1 0.7 0.9 1.1 2.7 0.1 0.3 0.1 1.0 0.0 0.5 5.3 0.6 0.3 0.7 0.0 0.1 1.7 2.9 0.3 0.9 2.0 3.9 0.9 0.6 0.0 1.9 0.8 1.7 0.9 0.0 1.0 0.7 0.1 52.2% 66.4% 69.2% 73.5% 74.8% 73.4% 72.5% 73.5% 73.6% 24.3% 73.5% 53.6% 55.0% 50.1% 60.1% 66.6% 65.4% 64.9% 62.0% 69.3% 69.2% 72.9% 72.7% 57.3% 56.8% 67.4% 56.7% 52.3% 58.7% 52.0% 73.7% 73.0% 65.6% 48.00 60.00 74.00 55.50 518.00 171.00 213.75 95.40 80.95 48.55 55.90 157.50 186.00 58.50 221.35 68.00 82.05 70.00 29.65 58.00 33.65 42.00 113.50 121.05 94.40 47.50 560.00 51.35 58.50 852.00 100.00 101.70 214.70 (Source: Capitaline, HDFCSec) 56.7 104.9 100.4 122.2 92.1 57.8 53.1 149.5 194.4 87.4 81.3 186.4 214.0 60.7 221.9 55.8 137.2 72.0 70.0 79.5 61.6 31.1 277.2 152.5 142.6 37.8 192.3 73.5 47.4 310.2 63.9 160.2 376.7 11.2 20.8 20.1 15.4 6.4 7.8 6.7 29.4 12.6 21.4 15.0 18.5 30.0 10.5 24.6 13.9 21.9 9.2 4.6 13.1 13.0 8.8 34.6 37.6 15.8 9.4 19.7 14.9 25.8 25.1 6.7 14.1 46.8 RETAIL RESEARCH P a g e | 7
RETAIL RESEARCH Fundamental Research Analyst: Arpit Bhatt (arpit.bhatt@hdfcsec.com) HDFC securities Limited, I Think Techno Campus, Building - B, "Alpha", Office Floor 8, Near Kanjurmarg Station, Opp. Crompton Greaves, Kanjurmarg (East), Mumbai 400 042 Phone: (022) 3075 3400 Fax: (022) 2496 5066 Website: www.hdfcsec.com Email: hdfcsecretailresearch@hdfcsec.com. Compliance Officer: Binkle R. Oza Email: complianceofficer@hdfcsec.com Phone: (022) 3045 3600 Disclosure: I, (Arpit Bhatt, CA), authors and the names subscribed to this report, hereby certify that all of the views expressed in this research report accurately reflect our views about the subject issuer(s) or securities. HSL has no material adverse disciplinary history as on the date of publication of this report. We also certify that no part of our compensation was, is, or will be directly or indirectly related to the specific recommendation(s) or view(s) in this report. Research Analyst or his/her relative or HDFC Securities Ltd. does not have any financial interest in the subject company. Also Research Analyst or his relative or HDFC Securities Ltd. or its Associate does not have beneficial ownership of 1% or more in the subject company at the end of the month immediately preceding the date of publication of the Research Report. Further Research Analyst or his relative or HDFC Securities Ltd. or its associate does not have any material conflict of interest. Any holding in stock – No HDFC Securities Limited (HSL) is a SEBI Registered Research Analyst having registration no. INH000002475. Disclaimer: This report has been prepared by HDFC Securities Ltd and is meant for sole use by the recipient and not for circulation. The information and opinions contained herein have been compiled or arrived at, based upon information obtained in good faith from sources believed to be reliable. Such information has not been independently verified and no guaranty, representation of warranty, express or implied, is made as to its accuracy, completeness or correctness. All such information and opinions are subject to change without notice. This document is for information purposes only. Descriptions of any company or companies or their securities mentioned herein are not intended to be complete and this document is not, and should not be construed as an offer or solicitation of an offer, to buy or sell any securities or other financial instruments. This report is not directed to, or intended for display, downloading, printing, reproducing or for distribution to or use by, any person or entity who is a citizen or resident or located in any locality, state, country or other jurisdiction where such distribution, publication, reproduction, availability or use would be contrary to law or regulation or what would subject HSL or its affiliates to any registration or licensing requirement within such jurisdiction. If this report is inadvertently send or has reached any individual in such country, especially, USA, the same may be ignored and brought to the attention of the sender. This document may not be reproduced, distributed or published for any purposes without prior written approval of HSL. Foreign currencies denominated securities, wherever mentioned, are subject to exchange rate fluctuations, which could have an adverse effect on their value or price, or the income derived from them. In addition, investors in securities such as ADRs, the values of which are influenced by foreign currencies effectively assume currency risk. It should not be considered to be taken as an offer to sell or a solicitation to buy any security. HSL may from time to time solicit from, or perform broking, or other services for, any company mentioned in this mail and/or its attachments. HSL and its affiliated company(ies), their directors and employees may; (a) from time to time, have a long or short position in, and buy or sell the securities of the company(ies) mentioned herein or (b) be engaged in any other transaction involving such securities and earn brokerage or other compensation or act as a market maker in the financial instruments of the company(ies) discussed herein or act as an advisor or lender/borrower to such company(ies) or may have any other potential conflict of interests with respect to any recommendation and other related information and opinions. HSL, its directors, analysts or employees do not take any responsibility, financial or otherwise, of the losses or the damages sustained due to the investments made or any action taken on basis of this report, including but not restricted to, fluctuation in the prices of shares and bonds, changes in the currency rates, diminution in the NAVs, reduction in the dividend or income, etc. HSL and other group companies, its directors, associates, employees may have various positions in any of the stocks, securities and financial instruments dealt in the report, or may make sell or purchase or other deals in these securities from time to time or may deal in other securities of the companies / organizations described in this report. HSL or its associates might have managed or co-managed public offering of securities for the subject company or might have been mandated by the subject company for any other assignment in the past twelve months. HSL or its associates might have received any compensation from the companies mentioned in the report during the period preceding twelve months from t date of this report for services in respect of managing or co-managing public offerings, corporate finance, investment banking or merchant banking, brokerage services or other advisory service in a merger or specific transaction in the normal course of business. HSL or its analysts did not receive any compensation or other benefits from the companies mentioned in the report or third party in connection with preparation of the research report. Accordingly, neither HSL nor Research Analysts have any material conflict of interest at the time of publication of this report. Compensation of our Research Analysts is not based on any specific merchant banking, investment banking or brokerage service transactions. HSL may have issued other reports that are inconsistent with and reach different conclusion from the information presented in this report. Research entity has not been engaged in market making activity for the subject company. Research analyst has not served as an officer, director or employee of the subject company. We have not received any compensation/benefits from the subject company or third party in connection with the Research Report. This report is intended for non-Institutional Clients only. The views and opinions expressed in this report may at times be contrary to or not in consonance with those of Institutional Research or PCG Research teams of HDFC Securities Ltd. and/or may have different time horizons HDFC Securities Limited, SEBI Reg. No.: NSE-INB/F/E 231109431, BSE-INB/F 011109437, AMFI Reg. No. ARN: 13549, PFRDA Reg. No. POP: 04102015, IRDA Corporate Agent License No.: HDF 2806925/HDF C000222657, SEBI Research Analyst Reg. No.: INH000002475, CIN - U67120MH2000PLC152193 RETAIL RESEARCH P a g e | 8