Download
1 / 13
130 likes | 132 Views
Entertainment Network Limited: Check out the institutional research report of Q4 result of Entertainment Network Ltd. ENIL’s 4QFY18 was in-line but muted. Revenue declined 3.7% YoY owing to high base and cut in ad volumes.

E N D
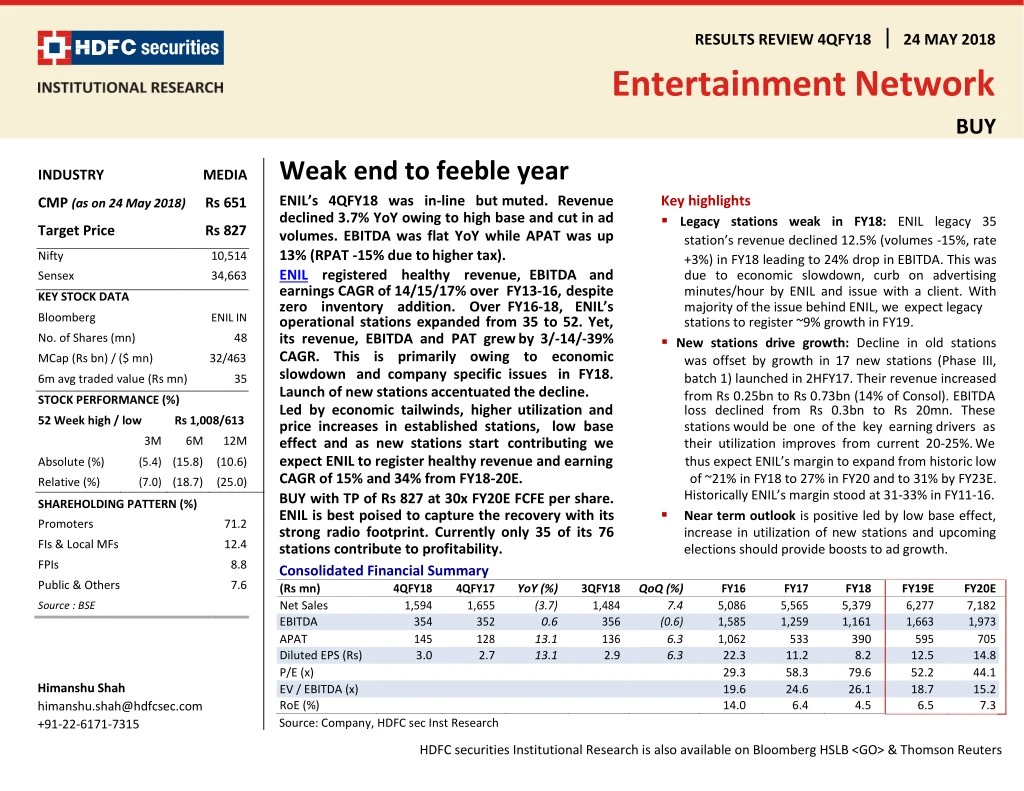
RESULTS REVIEW 4QFY18 Entertainment Network 24 MAY 2018 BUY Weak end to feeble year ENIL’s 4QFY18 was in-line but muted. Revenue declined 3.7% YoY owing to high base and cut in ad volumes. EBITDA was flat YoY while APAT was up 13% (RPAT -15% due to higher tax). ENIL registered healthy revenue, EBITDA and earnings CAGR of 14/15/17% over FY13-16, despite zero inventory addition. Over FY16-18, ENIL’s operational stations expanded from 35 to 52. Yet, its revenue, EBITDA and PAT grew by 3/-14/-39% CAGR. This is primarily owing to economic slowdown and company specific issues in FY18. Launch of new stations accentuated the decline. Led by economic tailwinds, higher utilization and price increases in established stations, low base effect and as new stations start contributing we expect ENIL to register healthy revenue and earning CAGR of 15% and 34% from FY18-20E. INDUSTRY MEDIA Key highlights ▪Legacy stations weak in FY18: ENIL legacy 35 station’s revenue declined 12.5% (volumes -15%, rate +3%) in FY18 leading to 24% drop in EBITDA. This was due to economic slowdown, curb on advertising minutes/hour by ENIL and issue with a client. With majority of the issue behind ENIL, we expect legacy stations to register ~9% growth in FY19. ▪New stations drive growth: Decline in old stations was offset by growth in 17 new stations (Phase III, batch 1) launched in 2HFY17. Their revenue increased from Rs 0.25bn to Rs 0.73bn (14% of Consol). EBITDA loss declined from Rs 0.3bn to Rs 20mn. These stations would be one of the key earning drivers as their utilization improves from current 20-25%. We thus expect ENIL’s margin to expand from historic low of ~21% in FY18 to 27% in FY20 and to 31% by FY23E. CMP (as on 24 May 2018) Rs 651 Target Price Rs 827 Nifty 10,514 Sensex 34,663 KEY STOCK DATA Bloomberg ENIL IN No. of Shares (mn) 48 MCap (Rs bn) / ($ mn) 32/463 6m avg traded value (Rs mn) 35 STOCK PERFORMANCE (%) 52 Week high / low Rs 1,008/613 3M 6M 12M Absolute (%) (5.4) (15.8) (10.6) Relative (%) SHAREHOLDING PATTERN (%) (7.0) (18.7) (25.0) Historically ENIL’s margin stood at 31-33% in FY11-16. ▪Near term outlook is positive led by low base effect, increase in utilization of new stations and upcoming elections should provide boosts to ad growth. BUY with TP of Rs 827 at 30x FY20E FCFE per share. ENIL is best poised to capture the recovery with its strong radio footprint. Currently only 35 of its 76 stations contribute to profitability. Consolidated Financial Summary (Rs mn) 4QFY18 Net Sales 1,594 EBITDA 354 APAT 145 Diluted EPS (Rs) 3.0 P/E (x) EV / EBITDA (x) RoE (%) Promoters 71.2 FIs & Local MFs 12.4 FPIs 8.8 Public & Others 7.6 4QFY17 1,655 352 128 YoY (%) (3.7) 3QFY18 1,484 356 136 QoQ (%) FY16 5,086 1,585 1,062 22.3 29.3 19.6 14.0 FY17 5,565 1,259 533 11.2 58.3 24.6 6.4 FY18 5,379 1,161 390 8.2 79.6 26.1 4.5 FY19E 6,277 1,663 595 12.5 52.2 18.7 6.5 FY20E 7,182 1,973 705 14.8 44.1 15.2 7.3 7.4 (0.6) 6.3 6.3 Source : BSE 0.6 13.1 13.1 2.7 2.9 Himanshu Shah himanshu.shah@hdfcsec.com +91-22-6171-7315 Source: Company, HDFC sec Inst Research HDFC securities Institutional Research is also available on Bloomberg HSLB <GO> & Thomson Reuters
ENIL : RESULTS REVIEW 4QFY18 Quarterly Financial Snapshot % chg FY17/ FY16 9.4 42.6 27.4 12.3 29.8 21.8 23.0 (20.6) 48.6 % chg FY18/ FY17 (3.3) 7.2 4.0 12.5 (15.5) (3.7) (2.0) (7.8) 18.4 (65.3) (51.1) (26.8) 11.2 (43.1) (34.7) % chg YoY % chg QoQ 4QFY17 1QFY18 2QFY18 3QFY18 4QFY18 FY16 FY17 FY18 ENIL’s 4QFY18 revenue decline is owing to high base effect (4QFY17 +13%, 4QFY16 +18%), cut in ad volumes to improve listenership and past issues with government as a client which stands resolved but recovery is slow Revenue Programming License fee Employee cost Mktg exps Other exps Total Opex EBITDA Depreciation Finance costs Other Income PBT Tax RPAT APAT Cash PAT (RPAT+Dep) 1,655 1,044 1,257 1,484 1,594 (3.7) 4.4 (2.0) 18.3 (3.2) (22.6) (4.8) 0.6 (3.5) (80.5) (45.3) 13.1 95.7 (15.9) 13.1 7.4 9.6 4.5 11.2 34.2 (12.5) 9.9 (0.6) (1.6) (21.4) 49.9 6.3 36.8 (10.0) 6.3 5,086 179 262 938 997 1,125 3,502 1,585 361 5,565 255 334 1,054 1,294 1,370 4,306 1,259 536 136 203 790 238 552 533 5,379 273 347 1,185 1,093 1,319 4,218 1,161 635 73 94 246 476 414 1,303 352 164 64 80 312 107 314 877 167 156 12 29 27 23 63 87 322 182 319 973 284 159 13 23 136 75 61 91 70 88 261 343 366 1,128 356 161 77 92 290 461 320 1,240 354 158 50 52 190 49 140 128 12 19 202 70 131 136 10 29 214 96 118 145 0 47 99 578 264 314 348 na 349 1,573 488 1,085 1,062 (41.9) (49.8) (51.2) (49.2) (49.8) Decline in other expenses QoQ/YoY owing to write back of provisions on collections improvement. ENIL prudently provides for 180 days plus outstanding and on collections the provision is reversed 3 (24) 305 160 220 292 277 (9.2) (5.4) 1,446 1,088 948 (24.8) (12.8) chg QoQ (bps) 10 (16) 63 578 (456) 178 (178) (91) (23) 51 (14) 130 (144) 1,001 4QFY18chg YoY FY18chg YoY chg YoY (bps) As % of revenue 4QFY17 1QFY18 2QFY18 3QFY18 FY16 FY17 (bps) (bps) Programming License fee Employee cost Mktg exps Other exps Total Opex EBITDA Depreciation Finance costs Other Income PBT Tax PAT Tax as % of PBT Source: Company, HDFC sec Inst Research 4.4 5.7 14.8 28.8 25.0 78.7 21.3 9.9 3.0 3.2 11.5 3.0 8.5 25.9 6.1 7.7 29.9 10.2 30.1 84.0 16.0 15.0 1.2 2.8 2.6 2.2 0.3 87.6 5.0 6.9 25.6 14.5 25.4 77.4 22.6 12.6 1.0 1.8 10.8 5.9 4.8 55.0 4.7 5.9 17.6 23.1 24.7 76.0 24.0 10.8 0.8 1.3 13.6 4.7 8.9 34.9 4.8 5.8 18.2 28.9 20.1 77.8 22.2 9.9 0.6 1.8 13.4 6.0 7.4 44.9 37 10 338 14 (493) (95) 95 3.5 5.1 18.4 19.6 22.1 68.8 31.2 7.1 0.0 6.9 30.9 9.6 21.3 31.0 4.6 6.0 18.9 23.3 24.6 77.4 22.6 9.6 2.4 3.6 14.2 4.3 9.9 30.1 5.1 6.5 22.0 20.3 24.5 78.4 21.6 11.8 0.9 1.8 10.8 4.9 5.8 45.7 107 85 48 364 249 854 (854) 254 243 (322) (1,673) (531) (1,142) (87) 50 46 310 (293) (9) 104 (104) 216 (156) (180) (344) 64 (408) 1,560 2 (243) (137) 199 306 (107) 1,894 Page | 2
ENIL : RESULTS REVIEW 4QFY18 Consolidated Financial Performance 1QFY17 Overall Revenue % chg YoY EBITDA EBITDA Margin % % chg YoY PAT PAT Margin % % chg YoY Legacy stations Revenue % chg YoY EBITDA EBITDA Margin % % chg YoY New stations Revenue EBITDA 2QFY17 3QFY17 4QFY17 1QFY18 2QFY18 3QFY18 4QFY18 FY16 FY17 FY18 1,108 9.0 294 1,296 11.5 231 1,506 4.9 381 1,655 12.4 352 1,044 (5.8) 167 1,257 (3.0) 284 1,484 (1.5) 356 1,594 (3.7) 354 5,086 16.0 1,585 5,565 9.4 1,259 5,379 (3.3) 1,161 26.6 17.8 25.3 21.3 16.0 22.6 24.0 22.2 31.2 22.6 21.6 Reduced losses in new stations lead to modest decline in EBITDA (16.8) 165 14.9 (39.1) (39.0) (18.5) 162 10.8 (46.6) (8.2) 128 7.7 (45.6) (43.3) 22.8 91 7.3 17.3 (6.6) 136 9.2 (16.0) 0.6 145 9.1 13.1 9.1 (20.6) 533 9.6 (49.8) (7.8) 390 7.3 (26.8) 78 6.0 18 1.7 1,062 20.9 0.2 (69.1) (89.1) Steep decline in legacy stations EBITDA owing to decline in utilization as ENIL curb advertising minutes/hour (volumes -15%) and offset the same through price increases (+3%) 1,108 9.0 371 1,296 11.5 329 1,410 (1.8) 444 1,495 1.6 415 937 (15.4) 210 1,116 (13.9) 302 1,270 (10.0) 345 1,327 (11.3) 324 5,086 16.0 1,585 5,310 4.4 1,559 4,650 (12.4) 1,181 33.5 25.4 31.5 27.8 22.4 27.0 27.2 24.5 31.2 29.4 25.4 4.7 (13.3) (5.0) 8.3 (43.2) (8.4) (22.4) (21.8) 9.1 (1.6) (24.2) - - 96 (63) 159 (63) 106 (44) 142 (18) 214 11 267 30 - - 256 (300) 729 (20) Industry peers witnessed a pric•e decline of 7-13% (76) (98) Page | 3
ENIL : RESULTS REVIEW 4QFY18 Revenue trend EBITDA trend chg YoY (%) - RHS chg YoY (%) - RHS Revenue (Rs Mn) EBITDA (Rs Mn) 25.0 1,750 25.0 500 ENIL’s revenue is down for 4th consecutive quarter, EBITDA has declined in 7 out of 8 quarters and RPAT is down for 10th quarter 20.0 15.0 1,550 400 15.0 5.0 1,350 300 10.0 (5.0) 5.0 (15.0) 200 1,150 - (25.0) 950 100 (5.0) (35.0) Multitude of factors has lead to sub-par performance of ENIL over FY16-18 such as (a) economic slowdown on account of GST, RERA, demonetization etc (b) operating losses on seventeen new stations launches, associated depreciation and interest costs (c) issue with government client in 1Q and 3QFY18 etc (d) ENIL is strategically reducing inventory to improve listenership. This reset is leading to volatility in growth. • 750 (10.0) - (45.0) 1QFY16 2QFY16 3QFY16 4QFY16 1QFY17 2QFY17 3QFY17 4QFY17 1QFY18 2QFY18 3QFY18 4QFY18 1QFY16 2QFY16 3QFY16 4QFY16 1QFY17 2QFY17 3QFY17 4QFY17 1QFY18 2QFY18 3QFY18 4QFY18 Source: Company, HDFC sec Inst Research Source: Company, HDFC sec Inst Research EBITDA margin trend 34.9 APAT trend chg YoY (%) - RHS RPAT (Rs Mn) % 35.0 25.0 350 32.6 300 - 32.6 30.0 250 26.6 (25.0) 25.3 200 24.0 26.0 25.0 22.6 150 (50.0) 21.3 100 22.2 20.0 (75.0) 50 17.8 16.0 - (100.0) 15.0 1QFY16 2QFY16 3QFY16 4QFY16 1QFY17 2QFY17 3QFY17 4QFY17 1QFY18 2QFY18 3QFY18 4QFY18 1QFY16 2QFY16 3QFY16 4QFY16 1QFY17 2QFY17 3QFY17 4QFY17 1QFY18 2QFY18 3QFY18 4QFY18 Source: Company, HDFC sec Inst Research Source: Company, HDFC sec Inst Research Page | 4
ENIL : RESULTS REVIEW 4QFY18 Revenue trend EBITDA trend EBITDA margin to improve from FY18 lows of 22% to 27% in FY20E and 31% by FY23E chg YoY (%) - RHS chg YoY (%) - RHS Revenue (Rs Mn) EBITDA (Rs Mn) 10,000 20.0 3,000 50.0 40.0 15.0 2,500 8,000 30.0 20.0 10.0 2,000 ENIL’s FCF generation is set to increase from current Rs 0.8bn p.a. in FY18 to ~Rs 1.3bn in FY20 and Rs 2-2.2bn by FY23E 6,000 10.0 5.0 1,500 - 4,000 (10.0) - 1,000 (20.0) (5.0) 500 (30.0) 2,000 FY13 FY14 FY15 FY16 FY18 FY23E FY19E FY20E FY21E FY22E FY17 FY18 FY23E FY13 FY14 FY15 FY16 FY17 FY19E FY20E FY21E FY22E Source: Company, HDFC sec Inst Research Source: Company, HDFC sec Inst Research EBITDA margin trend FCF FCF (Rs Mn) % 35.0 2,250 33.1 2,000 31.5 32.0 31.2 30.7 1,750 32.5 29.7 1,500 30.8 29.0 1,250 27.5 1,000 26.0 26.5 750 500 23.0 250 22.6 21.6 FY19E 20.0 - FY13 FY14 FY15 FY16 FY17 FY18 FY20E FY21E FY22E FY23E FY14 FY15 FY16 FY17 FY18 FY19E FY20E FY21E FY22E FY23E Source: Company, HDFC sec Inst Research Source: Company, HDFC sec Inst Research Page | 5
ENIL : RESULTS REVIEW 4QFY18 Key operating assumptions ENIL’s revenue to grow at 13% CAGR over FY18-23 primarily led by improved utilization in its new stations FY18E FY19E FY20E FY21E FY22E FY23E No of stations - established - Phase 3, Batch 1 - Phase 3, Batch 2 - Ishq FM Total Inventory Available (mn 10 sec slots)* - established - Phase 3, Batch 1 - Phase 3, Batch 2 - Ishq FM Total Inventory Sold (mn 10 sec slots)* - established - Phase 3, Batch 1 - Phase 3, Batch 2 - Ishq FM Total Inventory Sold (% chg YoY) - established - Phase 3, Batch 1 - Phase 3, Batch 2 - Ishq FM Total Utilization % - established - Phase 3, Batch 1 - Phase 3, Batch 2 - Ishq FM Average 35 17 21 35 17 21 3 76 35 17 21 3 76 35 17 21 3 76 35 17 21 3 76 35 17 21 3 76 - 73 ~70% of the incremental revenue to be contributed by new stations and Ishq FM . Share of new stations and Ishq FM to increase to 26% in FY23 from 13% in FY18E. 17.0 6.8 17.0 6.3 7.8 0.7 31.9 17.0 6.3 7.8 1.5 32.6 17.0 6.3 7.8 1.5 32.6 17.0 6.3 7.8 1.5 32.6 17.0 6.3 7.8 1.5 32.6 - - 23.8 13.1 1.5 13.7 1.9 0.3 0.4 16.3 13.5 2.3 1.7 1.0 18.5 13.8 2.9 2.6 1.0 20.4 14.0 3.4 3.4 1.1 21.9 14.2 3.9 4.2 1.1 23.4 A higher than expected growth remains could be additional upside - - 14.6 4.2 28.9 (1.0) 24.4 483.3 114.8 13.8 2.3 21.6 54.3 7.3 9.8 1.2 17.8 29.6 5.7 7.5 1.2 15.1 22.9 5.4 6.9 - - 11.8 77.2 21.5 80.5 29.8 3.8 60.8 51.1 79.7 37.0 21.9 65.3 56.8 81.5 45.0 33.8 70.0 62.4 82.5 53.0 43.8 74.0 67.1 83.5 61.0 53.8 78.0 71.7 - - 61.2 Page | 6
ENIL : RESULTS REVIEW 4QFY18 FY18E FY19E FY20E FY21E FY22E FY23E Realization/slot/station (Rs) - established - Phase 3, Batch 1 - Phase 3, Batch 2 - Ishq FM Average Realization/slot/station (% chg YoY) - established - Phase 3, Batch 1 - Phase 3, Batch 2 - Ishq FM Average Revenue (Rs Mn) - established - Phase 3, Batch 1 - Phase 3, Batch 2 - Ishq FM Total Revenue (% chg YoY) - established - Phase 3, Batch 1 - Phase 3, Batch 2 - Ishq FM Total Source: HDFC Sec Institutional Research 354 517 372 543 140 300 385 390 580 142 314 387 405 602 150 345 397 417 619 159 372 406 430 637 168 400 416 - - 370 5.0 5.1 5.0 6.9 0.8 4.7 0.5 3.8 3.8 6.3 10.0 2.4 3.0 2.9 5.8 7.8 2.3 3.0 2.9 5.9 7.6 2.5 - - 4.0 4,641 756 5,079 1,025 5,279 1,362 243 298 7,182 5,605 1,719 398 352 8,074 5,844 2,083 546 401 8,873 6,092 2,467 710 455 9,723 - - 41 132 6,277 5,397 9.4 35.5 4.0 32.9 487.8 124.9 14.4 6.2 26.2 64.1 18.0 12.4 4.3 21.2 37.1 14.0 9.9 4.2 18.4 30.0 13.4 9.6 - - 16.3 Page | 7
ENIL : RESULTS REVIEW 4QFY18 L and MBL Change in estimates New Old Change in % / bps FY19 (0.0) (0.0) (0) 6.3 FY19 6,277 1,663 26.5 595 FY20 7,182 1,973 27.5 705 FY19 6,277 1,663 26.5 560 FY20 7,182 1,973 27.5 692 FY20 (0.0) (0.0) (0) 1.9 Increase in our PAT estimate is due to marginal drop in D&A and higher other income Revenue (Rs Mn) EBITDA (Rs Mn) EBITDA Margin (%) PAT (Rs Mn) Source: HDFC Sec Inst Research Valuation Snapshot: ENI FY18 FY19E FY20E FY21E FY22E FY23E In the medium-to-long term we expect both MBL and ENIL to deliver similar stock returns ENIL* FCFE (Rs Mn) Target Multiple (x) Implied Mcap (Rs Mn) Implied TP (Rs) Upside to CMP (%) MBL FCFE (Rs Mn)** Target Multiple (x) Implied Mcap (Rs Mn) Implied TP (Rs) Upside to CMP (%) Source: HDFC Sec Inst Research * We have added back Rs 1.7bn Kolkata station of Anand Offset ** MBL’s FY18 FCF is subdued o Valuation Summary 712 30 806 30 1,314 1,622 1,873 2,152 30 30 30 30 21,350 24,195 508 (22.2) 39,424 48,657 56,189 64,567 448 827 26.8 1,021 56.5 1,179 80.8 1,354 107.7 (31.3) 964 30 In short term MBL can outperform ENIL 272 30 935 30 987 30 1,298 1,346 30 30 28,926 507 48.2 8,162 28,049 29,604 38,939 40,381 143 492 43.7 519 51.7 682 99.6 708 (58.2) 106.9 on of Ishq FM stations an d Rs 250mn in MBL for acquisiti in FCF of ENIL to be paid towards acquisiti in FY19E wing to Rs 390mn increase in working capi on of ta on acocunt of receiva bles as also decline in Payables l P/E (x) EV/EBTDA (x) P/FCFE (x) P/B (x) Core ROCE (%) CMP TP +/- % Rating FY18E FY19E FY20E FY18E FY19E FY20E FY18E FY19E FY20E FY18E FY19E FY20E FY18E FY19E FY20E ENIL 651 827 26.8 MBL 342 492 43.7 Source: HDFC Sec Inst Research BUY 79.6 52.2 44.1 26.1 18.7 15.2 42.5 (39.6) 23.7 3.5 3.3 3.2 3.4 6.7 7.7 BUY 37.7 27.9 22.5 18.1 14.0 11.4 71.7 27.3 20.9 3.3 3.0 2.8 12.0 15.4 18.8 Page | 8
ENIL : RESULTS REVIEW 4QFY18 Income Statement (Consolidated) Balance Sheet (Consolidated) FY20E 7,182 14.4 377 418 1,432 1,275 1,707 5,209 1,973 27.5 18.6 884 1,089 109 Year ending March (Rs mn) Net Sales Growth (%) Program & Loyalty exp License fee Employee cost Mktg exps Other exps Total Operating Cost EBIDTA EBIDTA (%) EBIDTA Growth (%) Depreciation EBIT Interest Other Income PBT Tax EO loss/(gain) RPAT APAT APAT Growth (%) AEPS EPS Growth (%) Source: Company, HDFC sec Inst Research FY16 5,086 16.0 179 262 938 997 1,125 3,502 1,585 31.2 9.1 361 1,224 FY17 5,565 9.4 255 334 1,054 1,294 1,370 4,306 1,259 22.6 (20.6) 536 723 136 203 790 238 FY18 5,379 (3.3) 273 347 1,185 1,093 1,319 4,218 1,161 21.6 (7.8) 635 526 FY19E 6,277 16.7 314 373 1,326 1,181 1,421 4,614 1,663 26.5 43.2 750 912 104 As at March (Rs mn) SOURCES OF FUNDS Share Capital Reserves Total Shareholders Funds Long Term Debt Short Term Debt Total Debt Other Non current liabilities TOTAL SOURCES OF FUNDS APPLICATION OF FUNDS Net Block Other Non current assets Non Current Assets Trade Receivables Other Current Assets Current Assets Trade Payables Other Current Liabilities Current Liabilities Net current Assets Cash & Equivalents TOTAL APPLICATION OF FUNDS Source: Company, HDFC sec Inst Research FY16 FY17 FY18 FY19E FY20E 477 7,608 8,084 477 8,097 8,574 477 8,398 8,875 477 8,887 9,364 477 9,385 9,861 - - - - - 2,501 2,501 131 10,716 1,232 1,232 185 9,990 1,040 1,040 333 10,247 1,144 1,144 383 10,890 915 915 440 11,216 7,275 404 7,678 1,403 179 1,582 800 303 1,103 479 2,559 10,716 7,795 300 8,095 1,622 307 1,928 1,116 272 1,388 540 1,355 9,990 7,356 460 7,815 1,702 234 1,936 1,049 284 1,333 603 1,828 10,247 8,755 480 9,235 1,781 268 2,049 1,116 349 1,465 583 1,072 10,890 8,071 500 8,571 2,057 324 2,380 1,333 389 1,722 659 1,987 11,216 0 47 99 578 264 (42) 356 390 (26.8) 8.2 (26.8) 73 349 1,573 488 80 888 293 1,052 347 - - - - 705 705 18.5 14.8 18.5 1,085 1,062 8.8 22.3 8.8 552 533 595 595 52.4 12.5 52.4 (49.8) 11.2 (49.8) Page | 9
ENIL : RESULTS REVIEW 4QFY18 Cash Flow (Consolidated) Year ending March (Rs mn) PAT from Operations Interest Depreciation Working Capital Change OPERATING CASH FLOW ( a ) Capex Free Cash Flow Investments & Others INVESTING CASH FLOW ( b ) Capital Issuance Debt Issuance Interest Dividend FINANCING CASH FLOW ( c ) NET CASH FLOW (a+b+c) Closing Cash Source: Company, HDFC sec Inst Research Key Ratios FY20E 705 109 884 (75) 1,623 (200) 1,423 FY16 1,085 FY17 552 136 536 (61) 1,162 (1,056) 106 157 (899) FY18 356 47 635 (63) 975 (195) 779 (11) (207) FY19E 595 104 750 FY16 FY17 FY18E FY19E FY20E PROFITABILITY (%) GPM EBITDA Margin EBIT Margin APAT Margin RoE Core ROCE RoCE EFFICIENCY Tax Rate (%) Asset Turnover (x) Debtors (days) Payables (days) Cash Conversion Cycle (days) Debt/EBITDA (x) Net D/E Interest Coverage 0 96.5 33.1 25.6 22.3 15.2 63.4 12.6 96.5 31.2 24.1 20.9 14.0 18.1 9.5 95.4 22.6 13.0 9.6 6.4 6.0 4.9 94.9 21.6 9.8 7.3 4.5 3.4 2.8 95.0 26.5 14.5 9.5 6.5 6.7 5.8 361 (151) 1,295 (7,105) (5,810) (24) (7,129) 20 1,469 (2,150) (681) 37 30 (163) (0) (229) (109) (208) (546) 914 1,987 (2,120) 1 (6) 1 - 26.7 8.3 104 62 27 (4.1) (0.8) 31.0 0.7 101 57 34 (0.0) (0.0) 30.1 0.7 106 73 35 (0.1) (0.0) 5.3 45.7 0.7 115 71 41 (0.7) (0.1) 11.2 33.0 0.7 104 65 34 0.0 0.0 8.8 2,498 (0) (56) 2,442 (3,392) 2,559 (1,269) (136) (56) (1,467) (1,203) 1,355 (192) (47) (56) (295) 473 1,828 104 (104) (105) (105) (756) 1,072 2,613.4 3,409.1 PER SHARE DATA EPS (Rs/sh) CEPS (Rs/sh) DPS (Rs/sh) BV (Rs/sh) VALUATION P/E P/BV EV/EBITDA OCF/EV (%) FCF/EV (%) FCFE/Mcap (%) EV/Revenues Dividend Yield (%) Source: Company, HDFC sec Inst Research 20.5 27.4 1.0 148.0 22.3 29.8 1.0 169.6 11.2 22.4 1.0 179.9 8.2 21.5 1.0 186.2 12.5 28.2 1.9 196.4 31.8 4.4 17.3 5.3 5.5 4.5 5.7 0.2 29.3 3.8 19.6 4.2 (18.7) (18.7) 6.1 0.2 58.3 3.6 24.6 3.8 0.3 (0.1) 5.6 0.2 79.6 3.5 26.1 3.2 2.6 2.4 5.6 0.2 52.2 3.3 18.7 4.7 (2.2) (2.5) 5.0 0.3 Page | 10
ENIL : RESULTS REVIEW 4QFY18 RECOMMENDATION HISTORY Date 20-Apr-18 24-May-18 CMP 693 651 Reco BUY BUY Target 827 827 ENIL TP 1,000 950 900 850 800 750 700 650 Rating Definitions BUY NEUTRAL : Where the stock is expected to deliver (-)10% to 10% returns over the next 12 month period SELL : Where the stock is expected to deliver less than (-)10% returns over the next 12 month period 600 : Where the stock is expected to deliver more than 10% returns over the next 12 month period Apr-18 Jul-17 Mar-18 Aug-17 Jan-18 Oct-17 May-18 May-17 Dec-17 Feb-18 Jun-17 Nov-17 Sep-17 Page | 11
ENIL : RESULTS REVIEW 4QFY18 Disclosure: I, Himanshu Shah, CA, author and the name subscribed to this report, hereby certify that all of the views expressed in this research report accurately reflect our views about the subject issuer(s) or securities. HSL has no material adverse disciplinary history as on the date of publication of this report. We also certify that no part of our compensation was, is, or will be directly or indirectly related to the specific recommendation(s) or view(s) in this report. Research Analyst or his/her relative or HDFC Securities Ltd. does not have any financial interest in the subject company. Also Research Analyst or his relative or HDFC Securities Ltd. or its Associate may have beneficial ownership of 1% or more in the subject company at the end of the month immediately preceding the date of publication of the Research Report. Further Research Analyst or his relative or HDFC Securities Ltd. or its associate does not have any material conflict of interest. Any holding in stock –No HDFC Securities Limited (HSL) is a SEBI Registered Research Analyst having registration no. INH000002475. Disclaimer: This report has been prepared by HDFC Securities Ltd and is meant for sole use by the recipient and not for circulation. The information and opinions contained herein have been compiled or arrived at, based upon information obtained in good faith from sources believed to be reliable. Such information has not been independently verified and no guaranty, representation of warranty, express or implied, is made as to its accuracy, completeness or correctness. All such information and opinions are subject to change without notice. This document is for information purposes only. Descriptions of any company or companies or their securities mentioned herein are not intended to be complete and this document is not, and should not be construed as an offer or solicitation of an offer, to buy or sell any securities or other financial instruments. This report is not directed to, or intended for display, downloading, printing, reproducing or for distribution to or use by, any person or entity who is a citizen or resident or located in any locality, state, country or other jurisdiction where such distribution, publication, reproduction, availability or use would be contrary to law or regulation or what would subject HSL or its affiliates to any registration or licensing requirement within such jurisdiction. If this report is inadvertently send or has reached any individual in such country, especially, USA, the same may be ignored and brought to the attention of the sender. This document may not be reproduced, distributed or published for any purposes without prior written approval of HSL. Foreign currencies denominated securities, wherever mentioned, are subject to exchange rate fluctuations, which could have an adverse effect on their value or price, or the income derived from them. In addition, investors in securities such as ADRs, the values of which are influenced by foreign currencies effectively assume currency risk. It should not be considered to be taken as an offer to sell or a solicitation to buy any security. HSL may from time to time solicit from, or perform broking, or other services for, any company mentioned in this mail and/or its attachments. HSL and its affiliated company(ies), their directors and employees may; (a) from time to time, have a long or short position in, and buy or sell the securities of the company(ies) mentioned herein or (b) be engaged in any other transaction involving such securities and earn brokerage or other compensation or act as a market maker in the financial instruments of the company(ies) discussed herein or act as an advisor or lender/borrower to such company(ies) or may have any other potential conflict of interests with respect to any recommendation and other related information and opinions. HSL, its directors, analysts or employees do not take any responsibility, financial or otherwise, of the losses or the damages sustained due to the investments made or any action taken on basis of this report, including but not restricted to, fluctuation in the prices of shares and bonds, changes in the currency rates, diminution in the NAVs, reduction in the dividend or income, etc. HSL and other group companies, its directors, associates, employees may have various positions in any of the stocks, securities and financial instruments dealt in the report, or may make sell or purchase or other deals in these securities from time to time or may deal in other securities of the companies / organizations described in this report. HSL or its associates might have managed or co-managed public offering of securities for the subject company or might have been mandated by the subject company for any other assignment in the past twelve months. HSL or its associates might have received any compensation from the companies mentioned in the report during the period preceding twelve months from t date of this report for services in respect of managing or co-managing public offerings, corporate finance, investment banking or merchant banking, brokerage services or other advisory service in a merger or specific transaction in the normal course of business. HSL or its analysts did not receive any compensation or other benefits from the companies mentioned in the report or third party in connection with preparation of the research report. Accordingly, neither HSL nor Research Analysts have any material conflict of interest at the time of publication of this report. Compensation of our Research Analysts is not based on any specific merchant banking, investment banking or brokerage service transactions. HSL may have issued other reports that are inconsistent with and reach different conclusion from the information presented in this report. Research entity has not been engaged in market making activity for the subject company. Research analyst has not served as an officer, director or employee of the subject company. We have not received any compensation/benefits from the subject company or third party in connection with the Research Report. HDFC securities Limited, I Think Techno Campus, Building - B, "Alpha", Office Floor 8, Near Kanjurmarg Station, Opp. Crompton Greaves, Kanjurmarg (East), Mumbai 400 042 Phone: (022) 3075 3400 Fax: (022) 2496 5066 Compliance Officer: Binkle R. Oza Email: complianceofficer@hdfcsec.com Phone: (022) 3045 3600 HDFC Securities Limited, SEBI Reg. No.: NSE-INB/F/E 231109431, BSE-INB/F 011109437, AMFI Reg. No. ARN: 13549, PFRDA Reg. No. POP: 04102015, IRDA Corporate Agent License No.: HDF 2806925/HDF C000222657, SEBI Research Analyst Reg. No.: INH000002475, CIN - U67120MH2000PLC152193 Mutual Funds Investments are subject to market risk. Please read the offer and scheme related documents carefully before investing. Page | 12
ENIL : RESULTS REVIEW 4QFY18 HDFC securities Institutional Equities Unit No. 1602, 16th Floor, Tower A, Peninsula Business Park, Senapati Bapat Marg, Lower Parel, Mumbai - 400 013 Board : +91-22-6171-7330 www.hdfcsec.com Page | 13