Download
1 / 11
110 likes | 115 Views
Our children marriage calculator helps you to understand how much amount you need to save in the future. Check out the investment schemes from HDFC securities and make your dream come true. Check out now!

E N D
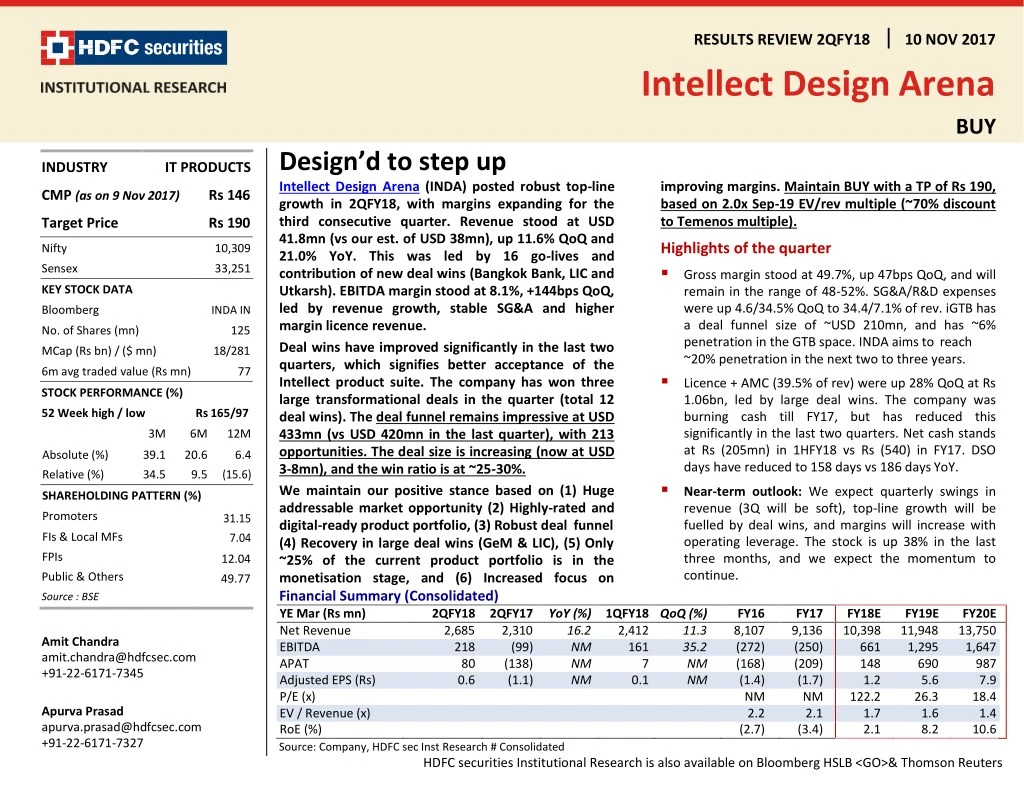
RESULTS REVIEW 2QFY18 Intellect Design Arena 10 NOV 2017 BUY Design’d to step up Intellect Design Arena (INDA) posted robust top-line growth in 2QFY18, with margins expanding for the third consecutive quarter. Revenue stood at USD 41.8mn (vs our est. of USD 38mn), up 11.6% QoQ and 21.0% YoY. This was led by 16 go-lives and contribution of new deal wins (Bangkok Bank, LIC and Utkarsh). EBITDA margin stood at 8.1%, +144bps QoQ, led by revenue growth, stable SG&A and higher margin licence revenue. Deal wins have improved significantly in the last two quarters, which signifies better acceptance of the Intellect product suite. The company has won three large transformational deals in the quarter (total 12 deal wins). The deal funnel remains impressive at USD 433mn (vs USD 420mn in the last quarter), with 213 opportunities. The deal size is increasing (now at USD 3-8mn), and the win ratio is at ~25-30%. We maintain our positive stance based on (1) Huge addressable market opportunity (2) Highly-rated and digital-ready product portfolio, (3) Robust deal funnel (4) Recovery in large deal wins (GeM & LIC), (5) Only ~25% of the current product portfolio is in the monetisation stage, and (6) Increased focus on Financial Summary (Consolidated) YE Mar (Rs mn) 2QFY18 2QFY17 Net Revenue 2,685 EBITDA APAT Adjusted EPS (Rs) P/E (x) EV / Revenue (x) RoE (%) INDUSTRY IT PRODUCTS improving margins. Maintain BUY with a TP of Rs 190, based on 2.0x Sep-19 EV/rev multiple (~70% discount to Temenos multiple). CMP (as on 9 Nov 2017) Rs 146 Target Price Rs 190 Highlights of the quarter ▪Gross margin stood at 49.7%, up 47bps QoQ, and will remain in the range of 48-52%. SG&A/R&D expenses were up 4.6/34.5% QoQ to 34.4/7.1% of rev. iGTB has a deal funnel size of ~USD 210mn, and has ~6% penetration in the GTB space. INDA aims to reach ~20% penetration in the next two to three years. ▪Licence + AMC (39.5% of rev) were up 28% QoQ at Rs 1.06bn, led by large deal wins. The company was burning cash till FY17, but has reduced this significantly in the last two quarters. Net cash stands at Rs (205mn) in 1HFY18 vs Rs (540) in FY17. DSO days have reduced to 158 days vs 186 days YoY. ▪Near-term outlook: We expect quarterly swings in revenue (3Q will be soft), top-line growth will be fuelled by deal wins, and margins will increase with operating leverage. The stock is up 38% in the last three months, and we expect the momentum to continue. Nifty 10,309 Sensex 33,251 KEY STOCK DATA Bloomberg INDA IN No. of Shares (mn) 125 MCap (Rs bn) / ($ mn) 18/281 6m avg traded value (Rs mn) 77 STOCK PERFORMANCE (%) 52 Week high / low Rs 165/97 3M 6M 12M Absolute (%) 39.1 20.6 6.4 Relative (%) SHAREHOLDING PATTERN (%) 34.5 9.5 (15.6) Promoters 31.15 FIs & Local MFs 7.04 12.04 49.77 FPIs Public & Others Source : BSE YoY (%) 1QFY18 QoQ (%) 16.2 2,412 NM 161 NM NM FY16 8,107 (272) (168) (1.4) NM 2.2 (2.7) FY17 9,136 (250) (209) (1.7) NM 2.1 (3.4) FY18E 10,398 661 148 FY19E 11,948 1,295 690 FY20E 13,750 1,647 987 7.9 18.4 1.4 10.6 2,310 (99) (138) (1.1) 11.3 35.2 NM NM Amit Chandra amit.chandra@hdfcsec.com +91-22-6171-7345 218 80 0.6 7 0.1 1.2 5.6 26.3 1.6 8.2 122.2 1.7 2.1 Apurva Prasad apurva.prasad@hdfcsec.com +91-22-6171-7327 Source: Company, HDFC sec Inst Research # Consolidated HDFC securities Institutional Research is also available on Bloomberg HSLB <GO>& Thomson Reuters
INTELLECT DESIGN ARENA : RESULTS REVIEW 2QFY18 Quarterly Consolidated Financials Snapshot Particulars (Rs mn) Net Revenue US$ mn Net Revenue Software development expenses (SDE) SG&A 2QFY18 41.8 2,685 1,352 2QFY17 34.5 2,310 1,154 YoY (%) 21.0 16.2 17.1 1QFY18 37.4 2,412 1,226 QoQ (%) 11.6 11.3 10.3 Revenue growth was led by high licence revenue received from one large transformational deal (Bangkok Bank) signed in the quarter 923 1,056 (12.6) 882 4.6 R&D EBITDA 192 199 (3.6) 142 34.5 218 (99) NM 161 35.2 Depreciation EBIT 59 61 (2.8) 59 0.7 159 (160) NM 103 55.0 Other Income Interest Cost 33 37 NM 30 10.8 Margins improved, owing to stringent cost control and top- line growth 39 24 63.7 42 (5.8) PBT Tax 153 (147) NM 91 68.5 18 27 (31.9) 36 (49.4) Minority Interest RPAT 55 (36) NM 47 16.4 80 (138) NM 7 984.6 EO Items (Adj For Tax) APAT 0 0 NM 0 NM 80 (138) NM 7 984.6 The company’s main focus area is Global Transaction Banking (iGTB) and Insurance (iSEC) Source: Company, HDFC sec Inst Research Margin Analysis MARGIN ANALYSIS % Employee Expenses % Net Revenue 2QFY18 50.3 2QFY17 50.0 YoY (%) 1QFY18 50.8 QoQ (%) (47) 39 SG&A Expenses % Net Revenue R&D Expenses % Net Revenue Gross Margin % EBITDA Margin (%) EBIT Margin (%) Tax Rate (%) APAT Margin (%) Source: Company, HDFC sec Inst Research 34.4 7.1 49.7 8.1 5.9 12.0 3.0 45.7 8.6 50.0 (4.3) (6.9) (18.4) (6.0) (1,133) (147) (39) 1,240 1,284 NM 895 36.6 5.9 49.2 6.7 4.3 40.1 0.3 (220) 123 47 144 167 NM 266 R&D and sales investments are almost complete, and will provide operative leverage with growth Page | 2
INTELLECT DESIGN ARENA : RESULTS REVIEW 2QFY18 Intellect USD Revenue Trend USD Revenue YoY Growth Rate Revenue (US$ mn) QoQ growth (RHS) (%, YoY) 30.0 (US$ mn) (%, QoQ) Clocked highest revenue growth in the last six quarters 15 24.0 25.0 21.7 40 21.0 10 20.0 35 16.5 14.3 13.8 5 15.0 30 8.0 0 10.0 25 (5) 5.0 20 31.9 29.4 32.1 30.7 34.5 33.6 37.4 37.4 41.8 1.2 0.0 15 (10) SG&A investment has been almost completed, and will remain at current levels 3QFY16 4QFY16 1QFY17 2QFY17 3QFY17 4QFY17 1QFY18 2QFY18 2QFY16 3QFY16 4QFY16 1QFY17 2QFY17 3QFY17 4QFY17 1QFY18 2QFY18 Source: Company, HDFC sec Inst Research Source: Company, HDFC sec Inst Research SG&A Trend R&D Expense Trend % of Revenue (RHS) % of Revenue (RHS) SG&A Expenses R&D Expenses (Rs mn) (Rs mn) R&D capitalisation stood at Rs 260mn in the quarter 1,200 400 60% 20% 18% 16% 14% 12% 10% 8% 6% 4% 2% 0% 350 300 1,000 50% 800 40% 250 600 30% 200 150 400 20% 100 1,013 1,056 1,032 820 803 983 933 882 923 338 336 156 199 198 167 200 142 192 10% 93 50 0 0% 0 2QFY16 3QFY16 4QFY16 1QFY17 2QFY17 3QFY17 4QFY17 1QFY18 2QFY18 2QFY16 3QFY16 4QFY16 1QFY17 2QFY17 3QFY17 4QFY17 1QFY18 2QFY18 Source: Company, HDFC sec Inst Research Source: Company, HDFC sec Inst Research Page | 3
INTELLECT DESIGN ARENA : RESULTS REVIEW 2QFY18 R&D And SG&A Investment Burning Cash License & Implementation Fee As % Of Revenue R&D Expenses (including cap.) (Rs mn) % of Revenue (RHS) Total R&D expenses (including capitalisation) increased 6.9% QoQ to Rs 451.5mn (16.8% of revenue) Licence +AMC % Implemention % 80% 500 25% 70% 67% 67% 66% 66% 65% 64% 65% 70% 61% 400 20% 57% 60% 300 15% 50% 43% 40% 35% 36% 35% 200 10% 34% 30% 33% 33% 34% 40% 30% Middle-East, Africa and India are the key focus markets 100 5% 338 336 321 416 421 428 447 422 452 20% 0 0% 1QFY16 2QFY16 3QFY16 4QFY16 1QFY17 2QFY17 3QFY17 4QFY17 1QFY18 2QFY18 2QFY16 3QFY16 4QFY16 1QFY17 2QFY17 3QFY17 4QFY17 1QFY18 2QFY18 Source: Company, HDFC sec Inst Research Source: Company, HDFC sec Inst Research; TTM basis Page | 4
INTELLECT DESIGN ARENA : RESULTS REVIEW 2QFY18 Change In Estimates Particulars FY18E Revenue (USD mn) Earlier estimates Revised estimates % change 154 161 4.6 Revenue (Rs mn) EBITDA (Rs mn) EBITDA margin (%) APAT FY19E Revenue (USD mn) Revenue (Rs mn) EBITDA (Rs mn) EBITDA margin (%) APAT Source: Company, HDFC sec Inst Research 9,943 579 5.8 186 10,398 661 4.6 14.1 53 (20.3) 6.4 148 176 184 4.3 4.3 4.7 11,451 1,236 10.8 767 11,948 1,295 10.8 690 4 (10.0) Assumptions Particulars Total License & AMC Growth (%) Total System Integration Growth (%) Total USD Revenue Growth (%) USD/INR Rate EBITDA Margin (%) Source: Company, HDFC sec Inst Research FY16 30.2 21.7 24.4 65.5 (3.4) FY17 16.2 6.8 10.0 67.1 (2.7) FY18E 24.1 14.6 18.0 64.7 6.4 FY19E 21.8 9.8 14.4 65.0 10.8 FY20E 18.8 12.6 15.1 65.0 11.0 Page | 5
INTELLECT DESIGN ARENA : RESULTS REVIEW 2QFY18 Peer Valuation Mcap (Rs bn) Revenue (USD mn) EBITDA (Rs bn) EBITDA Margin % EV/revenue (x) EV/EBITDA (x) Relative Valuation 17-20E CAGR % YE FY17 FY18E FY19E FY20E FY17 FY18E FY19E FY20E FY17 FY18E FY19E FY20E FY17 FY18E FY19E FY20E FY17 FY18E FY19E FY20E Majesco Intellect Source: Company, Bloomberg, HDFC sec Inst Research Mar 12.6 121.8 127.3 153.5 185.8 Mar 18.3 136.2 160.7 183.8 211.5 15.0 15.6 0.3 (0.2) 0.3 0.7 0.8 1.3 1.3 1.6(2.7) 3.9 4.2 6.4 8.0 10.8 10.5 12.0 1.4 2.1 1.4 1.7 1.2 1.6 0.9 1.4(77.4) 35.7 33.4 27.5 14.4 14.5 8.6 11.9 Page | 6
INTELLECT DESIGN ARENA : RESULTS REVIEW 2QFY18 Income Statement (Consolidated) YE March (Rs mn) Net Revenues (US $mn) Balance Sheet (Consolidated) YE March (Rs mn) SOURCES OF FUNDS Share Capital - Equity FY20E 212 FY16 124 FY17 FY18E 136 FY19E 184 FY16 FY17 FY18E FY19E FY20E 161 15.1% 504 509 509 509 509 Growth (%) Net Revenues (Rs mn) 24.5% 10.0% 18.0% 8,107 9,136 10,398 11,948 13,750 14.4% Reserves Total Shareholders Funds 5,687 6,190 5,475 5,983 7,613 8,122 8,303 8,812 9,290 9,799 15.1% 6,584 Growth (%) Software development expenses (SDE) 33.2% 12.7% 13.8% 3,913 4,633 14.9% 5,860 Total Debt Net Deferred Taxes 229 (66) 2,324 (113) 1,824 (113) 1,824 (113) 1,824 (113) 5,295 4,523 995 1,647 12.0% SG&A EBITDA Margin (%) 3,403 1,063 (272) -3.4% 4,034 719 (250) -2.7% 3,708 734 661 6.4% 3,939 854 1,295 10.8% Long Term Provisions & Others TOTAL SOURCES OF FUNDS 33 1 1 1 1 R&D EBITDA 6,387 8,195 10,028 10,903 12,085 APPLICATION OF FUNDS CWIP Investments Total Non-current Assets Other Current Assets Total Current Assets Creditors 10.6% 251 Net Block 1,948 2,005 2,082 2,179 2,341 EBITDA Growth (%) Depreciation NM 208 NM 241 NM 235 70.5% 261 655 778 1,383 773 2,424 773 3,542 773 4,902 773 1,397 165 Goodwill EBIT Other Income (Including EO Items) (480) 227 (491) 358 426 132 1,033 143 310 887 222 976 222 1,092 222 1,255 222 1,444 84 LT Loans & Advances Interest PBT 12 113 (246) 121 437 84 4,579 1,604 5,359 2,048 6,592 2,279 7,971 2,455 9,681 2,825 (264) 1,093 1,478 296 196 Debtors Tax (Incl Deferred) Minority Interest (91) (5) 28 93 195 219 184 2,527 846 2,790 1,532 2,901 2,144 3,333 1,523 3,836 757 (66) 987 Cash & Equivalents RPAT APAT APAT Growth (%) (168) (209) 148 690 4,977 1,821 6,371 1,441 7,324 1,601 7,312 1,751 7,418 1,990 EO (Loss) / Profit (Net Of Tax) 0 0 0 0 0 (168) NM (209) NM 148 NM 690 987 Other Current Liabilities & Provns Net Current Assets Source: Company, HDFC sec Inst Research 1,348 3,169 2,094 3,535 2,288 3,888 2,629 4,380 3,025 5,015 11.3% 11.3% 7.9 Total Current Liabilities Adjusted EPS (Rs) EPS Growth (%) -1.4 NM -1.7 NM 1.2 NM 5.6 1,808 6,387 2,836 8,195 3,436 10,028 2,932 10,903 12,085 2,404 11.3% 11.3% Source: Company, HDFC sec Inst Research TOTAL APPLICATION OF FUNDS Page | 7
INTELLECT DESIGN ARENA : RESULTS REVIEW 2QFY18 Cash Flow Statement (Consolidated) YE March (Rs mn) Reported PBT Non-operating & EO items Interest expenses Depreciation Working Capital Change Tax Paid OPERATING CASH FLOW ( a ) Capex Key Ratios (Consolidated) FY16 FY17 FY18E FY19E FY20E FY16 (264) 26 12 208 (884) (199) (1,102) (832) (1,026) (1,353) (1,477) (1,772) FY17 (246) (358) 113 241 (463) (28) (741) FY18E 437 (132) 121 235 (103) (93) 464 FY19E 1,093 (143) FY20E 1,478 (165) PROFITABILITY (%) GPM EBITDA Margin APAT Margin RoE RoIC (or Core RoCE) RoCE EFFICIENCY 51.7 (3.4) (2.1) (2.7) (3.8) (1.7) 49.3 (2.7) (2.3) (3.4) (5.7) (0.8) 49.1 6.4 1.4 2.1 3.0 1.9 51.0 10.8 5.8 8.2 6.3 5.2 52.1 12.0 7.2 10.6 7.3 6.5 84 261 (280) (219) 796 84 251 (428) (296) 924 Tax Rate (%) Fixed Asset Turnover (x) Debtors (days) Other Current Assets (days) Payables (days) Other Current Liab & Provns (days) Cash Conversion Cycle (days) Debt/EBITDA (x) Net D/E (x) Interest Coverage (x) PER SHARE DATA (Rs) EPS CEPS Dividend Book Value VALUATION 34.3 1.9 72.2 113.8 79.3 60.7 46.0 (0.8) (0.1) (22.8) (11.5) 2.0 81.8 111.5 56.0 83.7 53.6 (9.3) 0.2 (2.2) 21.4 2.1 80.0 101.8 60.0 80.3 41.5 2.8 0.0 5.5 20.0 2.3 75.0 101.8 60.0 80.3 36.5 1.4 0.1 15.5 20.0 2.4 75.0 101.8 60.0 80.3 36.5 1.1 0.1 19.7 Free cash flow (FCF) Investments Non-operating Income INVESTING CASH FLOW ( b ) (1,934) (1,767) (51) 84 (799) (888) (681) (848) (77) 358 (745) (1,221) (1,334) (1,607) 0 0 0 132 143 165 Debt Issuance/(Repaid) Interest Expenses FCFE Share Capital Issuance/Rights Issue Dividend FINANCING CASH FLOW ( c ) NET CASH FLOW (a+b+c) EO Items, Others 152 (12) 2,095 (113) 215 (1,509) 5 0 1,986 500 (186) (500) (121) 0 0 (84) (764) (84) (932) (1,793) 41 0 181 1,990 0 0 0 0 0 1,369 612 (84) (621) (84) (767) (1,719) (11) (1.4) 0.3 0.0 49.8 (1.7) 0.3 0.0 48.2 1.2 3.1 0.0 65.4 5.6 7.7 0.0 70.9 7.9 10.0 0.0 78.9 0 0 0 Closing Cash & Equivalents Source: Company, HDFC sec Inst Research 846 1,532 2,144 1,523 757 P/E (x) P/BV (x) EV/EBITDA (x) EV/Revenues (x) NM 2.9 NM 3.0 122.2 2.2 27.5 1.7 26.3 2.1 14.5 1.6 18.4 1.9 11.9 1.4 (65.6) 2.2 (77.4) 2.1 OCF/EV (%) FCF/EV (%) (6.2) (10.9) (3.8) (9.2) 2.6 (4.9) 4.2 (3.6) 4.7 (4.3) FCFE/Mkt Cap (%) Dividend Yield (%) (9.9) 0.0 1.2 0.0 (8.3) 0.0 (4.2) 0.0 (5.1) 0.0 Source: Company, HDFC sec Inst Research; N.A – Not Applicable, NM – Not Meaningful Page | 8
INTELLECT DESIGN ARENA : RESULTS REVIEW 2QFY18 RECOMMENDATION HISTORY Date 5-Nov-16 13-Feb-17 11-Apr-17 4-May-17 15-Aug-17 4-Oct-17 10-Nov-17 CMP 140 114 106 123 103 119 146 Reco BUY BUY BUY BUY BUY BUY BUY Target 223 199 201 205 180 184 190 Intellect Design Arena TP 240 220 200 180 160 140 120 100 80 60 Rating Definitions BUY NEUTRAL : Where the stock is expected to deliver (-)10% to 10% returns over the next 12 month period SELL : Where the stock is expected to deliver less than (-)10% returns over the next 12 month period Aug-17 Oct-17 : Where the stock is expected to deliver more than 10% returns over the next 12 month period Jul-17 Jan-17 Apr-17 Sep-17 Nov-17 Mar-17 Dec-16 May-17 Nov-16 Feb-17 Jun-17 Page | 9
INTELLECT DESIGN ARENA : RESULTS REVIEW 2QFY18 Disclosure: We, Amit Chandra, MBA & Apurva Prasad, MBA, authors and the names subscribed to this report, hereby certify that all of the views expressed in this research report accurately reflect our views about the subject issuer(s) or securities. HSL has no material adverse disciplinary history as on the date of publication of this report. We also certify that no part of our compensation was, is, or will be directly or indirectly related to the specific recommendation(s) or view(s) in this report. Research Analyst or his/her relative or HDFC Securities Ltd. does not have any financial interest in the subject company. Also Research Analyst or his relative or HDFC Securities Ltd. or its Associate may have beneficial ownership of 1% or more in the subject company at the end of the month immediately preceding the date of publication of the Research Report. Further Research Analyst or his relative or HDFC Securities Ltd. or its associate does not have any material conflict of interest. Any holding in stock –No HDFC Securities Limited (HSL) is a SEBI Registered Research Analyst having registration no. INH000002475. Disclaimer: This report has been prepared by HDFC Securities Ltd and is meant for sole use by the recipient and not for circulation. The information and opinions contained herein have been compiled or arrived at, based upon information obtained in good faith from sources believed to be reliable. Such information has not been independently verified and no guaranty, representation of warranty, express or implied, is made as to its accuracy, completeness or correctness. All such information and opinions are subject to change without notice. This document is for information purposes only. Descriptions of any company or companies or their securities mentioned herein are not intended to be complete and this document is not, and should not be construed as an offer or solicitation of an offer, to buy or sell any securities or other financial instruments. This report is not directed to, or intended for display, downloading, printing, reproducing or for distribution to or use by, any person or entity who is a citizen or resident or located in any locality, state, country or other jurisdiction where such distribution, publication, reproduction, availability or use would be contrary to law or regulation or what would subject HSL or its affiliates to any registration or licensing requirement within such jurisdiction. If this report is inadvertently send or has reached any individual in such country, especially, USA, the same may be ignored and brought to the attention of the sender. This document may not be reproduced, distributed or published for any purposes without prior written approval of HSL. Foreign currencies denominated securities, wherever mentioned, are subject to exchange rate fluctuations, which could have an adverse effect on their value or price, or the income derived from them. In addition, investors in securities such as ADRs, the values of which are influenced by foreign currencies effectively assume currency risk. It should not be considered to be taken as an offer to sell or a solicitation to buy any security. HSL may from time to time solicit from, or perform broking, or other services for, any company mentioned in this mail and/or its attachments. HSL and its affiliated company(ies), their directors and employees may; (a) from time to time, have a long or short position in, and buy or sell the securities of the company(ies) mentioned herein or (b) be engaged in any other transaction involving such securities and earn brokerage or other compensation or act as a market maker in the financial instruments of the company(ies) discussed herein or act as an advisor or lender/borrower to such company(ies) or may have any other potential conflict of interests with respect to any recommendation and other related information and opinions. HSL, its directors, analysts or employees do not take any responsibility, financial or otherwise, of the losses or the damages sustained due to the investments made or any action taken on basis of this report, including but not restricted to, fluctuation in the prices of shares and bonds, changes in the currency rates, diminution in the NAVs, reduction in the dividend or income, etc. HSL and other group companies, its directors, associates, employees may have various positions in any of the stocks, securities and financial instruments dealt in the report, or may make sell or purchase or other deals in these securities from time to time or may deal in other securities of the companies / organizations described in this report. HSL or its associates might have managed or co-managed public offering of securities for the subject company or might have been mandated by the subject company for any other assignment in the past twelve months. HSL or its associates might have received any compensation from the companies mentioned in the report during the period preceding twelve months from t date of this report for services in respect of managing or co-managing public offerings, corporate finance, investment banking or merchant banking, brokerage services or other advisory service in a merger or specific transaction in the normal course of business. HSL or its analysts did not receive any compensation or other benefits from the companies mentioned in the report or third party in connection with preparation of the research report. Accordingly, neither HSL nor Research Analysts have any material conflict of interest at the time of publication of this report. Compensation of our Research Analysts is not based on any specific merchant banking, investment banking or brokerage service transactions. HSL may have issued other reports that are inconsistent with and reach different conclusion from the information presented in this report. Research entity has not been engaged in market making activity for the subject company. Research analyst has not served as an officer, director or employee of the subject company. We have not received any compensation/benefits from the subject company or third party in connection with the Research Report. HDFC securities Limited, I Think Techno Campus, Building - B, "Alpha", Office Floor 8, Near Kanjurmarg Station, Opp. Crompton Greaves, Kanjurmarg (East), Mumbai 400 042 Phone: (022) 3075 3400 Fax: (022) 2496 5066 Compliance Officer: Binkle R. Oza Email: complianceofficer@hdfcsec.com Phone: (022) 3045 3600 HDFC Securities Limited, SEBI Reg. No.: NSE-INB/F/E 231109431, BSE-INB/F 011109437, AMFI Reg. No. ARN: 13549, PFRDA Reg. No. POP: 04102015, IRDA Corporate Agent License No.: HDF 2806925/HDF C000222657, SEBI Research Analyst Reg. No.: INH000002475, CIN - U67120MH2000PLC152193 Mutual Funds Investments are subject to market risk. Please read the offer and scheme related documents carefully before investing. Page | 10
INTELLECT DESIGN ARENA : RESULTS REVIEW 2QFY18 HDFC securities Institutional Equities Unit No. 1602, 16th Floor, Tower A, Peninsula Business Park, Senapati Bapat Marg, Lower Parel,Mumbai - 400 013 Board : +91-22-6171 7330 www.hdfcsec.com Page | 11