Download
1 / 1
10 likes | 106 Views
Web portal Interface Information input, display, query and output services Preliminary data exploration and discovery. See what is available and perform exploratory analyses. USGS. Data Source. Streamflow gages. Network. Neuse River near Clayton, NC. Sites. 3 rd party servers.

E N D
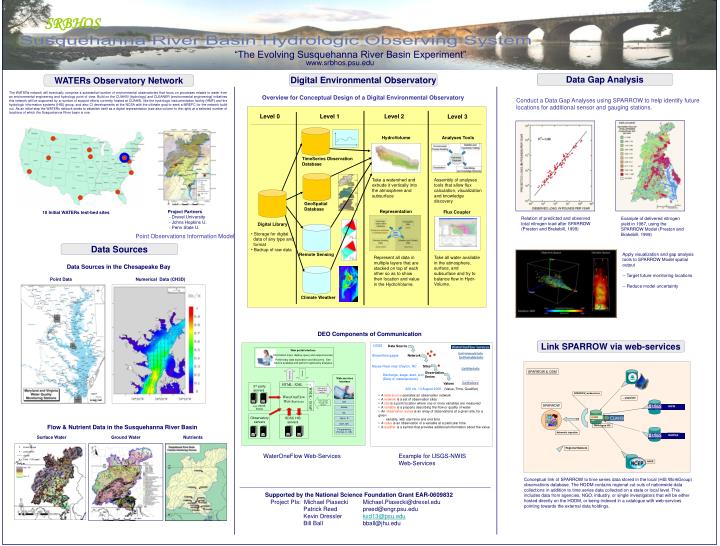
Web portal Interface Information input, display, query and output services Preliminary data exploration and discovery. See what is available and perform exploratory analyses USGS Data Source Streamflow gages Network Neuse River near Clayton, NC Sites 3rd party servers Web services interface ObservationSeries Discharge, stage, start, end (Daily or instantaneous) NAWQA Values e.g. USGS, NCDC 206 cfs, 13 August 2006 {Value, Time, Qualifier} GIS • A data source operates an observation network • A network is a set of observation sites • A site is a point location where one or more variables are measured • A variable is a property describing the flow or quality of water • An observation series is an array of observations at a given site, for a given variable, with start time and end time • A value is an observation of a variable at a particular time • A qualifier is a symbol that provides additional information about the value NWIS Matlab IDL Observatory servers SDSC HIS servers Splus, R D2K, I2K Programming (Fortran, C, VB) Digital Library Downloads Uploads HTML -XML Data access through web services WaterOneFlow Web Services WSDL - SOAP Data storage through web services SPARROW & ODM SPARROW_webservices …populate SPARROW HODM WorkGroup HIS Automatic ingestion Regional Subsets NARR SRBHOS “The Evolving Susquehanna River Basin Experiment” www.srbhos.psu.edu Data Gap Analysis Digital Environmental Observatory WATERs Observatory Network The WATERs network will eventually comprise a substantial number of environmental observatories that focus on processes related to water from an environmental engineering and hydrology point of view. Build on the CUAHSI (hydrology) and CLEANER (environmental engineering) initiatives this network will be supported by a number of support efforts currently hosted at CUAHSI, like the hydrologic instrumentation facility (HMF) and the hydrologic information systems (HIS) group, and also CI developments at the NCSA with the ultimate goal to seek a MREFC for the network build out. As an initial step the WATERs network seeks to establish itself as a digital representation (see also column to the right) at a selected number of locations of which the Susquehanna River basin is one. Overview for Conceptual Design of a Digital Environmental Observatory Conduct a Data Gap Analyses using SPARROW to help identify futurelocations for additional sensor and gauging stations. Level 0 Level 1 Level 2 Level 3 HydroVolume Analyses Tools TimeSeries Observation Database Take a watershed and extrude it vertically into the atmosphere and subsurface Assembly of analyses tools that allow flux calculation, visualization and knowledge discovery GeoSpatial Database Representation Project Partners - Drexel University - Johns Hopkins U. - Penn State U. Flux Coupler 10 Initial WATERs test-bed sites Relation of predicted and observed total nitrogen load after SPARROW (Preston and Brakebill, 1999) Example of delivered nitrogen yield in 1987, using the SPARROW Model (Preston and Brakebill, 1999) • Storage for digital data of any type and format • Backup of raw data Point Observations Information Model Data Sources Apply visualization and gap analysis tools to SPARROW Model spatial output-- Target future monitoring locations-- Reduce model uncertainty Remote Sensing Take all water available in the atmosphere, surface, and subsurface and try to balance flow in Hydr-Volume. Represent all data in multiple layers that are stacked on top of each other so as to show their location and value in the HydroVolume. Data Sources in the Chesapeake Bay Point Data Numerical Data (CH3D) Climate Weather DEO Components of Communication Link SPARROW via web-services Flow & Nutrient Data in the Susquehanna River Basin Surface Water Ground Water Nutrients WaterOneFlow Web-Services Example for USGS-NWIS Web-Services Conceptual link of SPARROW to time series data stored in the local (HIS WorkGroup)observations database. The HODM contains regional cut outs of nationwide data collections in addition to time series data collected on a state or local level. This includes data from agencies, NGO, industry, or single investigators that will be either hosted directly on the HODM, or being indexed in a catalogue with web-services pointing towards the external data holdings. Supported by the National Science Foundation Grant EAR-0609832 Project PIs: Michael Piasecki Michael.Piasecki@drexel.edu Patrick Reed preed@engr.psu.edu Kevin Dressler kxd13@psu.edu Bill Ball bball@jhu.edu