Download
1 / 19
190 likes | 322 Views
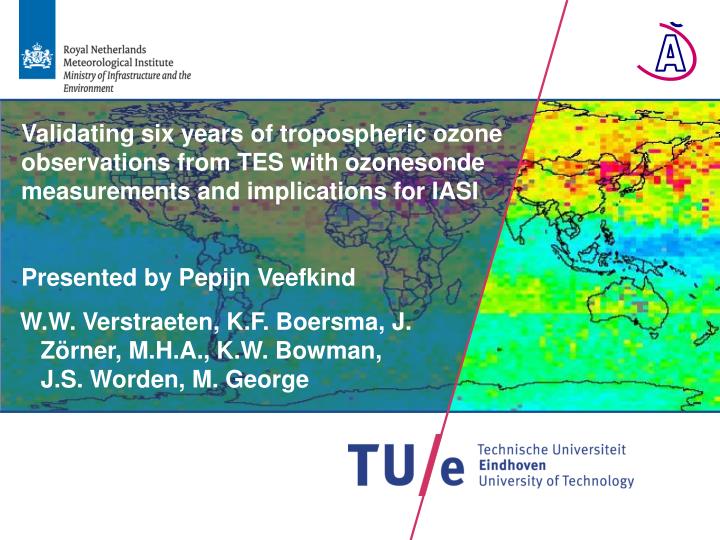
Validating six years of tropospheric ozone observations from TES with ozonesonde measurements and implications for IASI Presented by Pepijn Veefkind. W.W. Verstraeten, K.F. Boersma, J. Z ö rner, M.H.A., K.W. Bowman, J.S. Worden, M. George. Measuring changes in tropospheric ozone.

E N D
Validating six years of tropospheric ozone observations from TES with ozonesonde measurements and implications for IASI Presented by Pepijn Veefkind W.W. Verstraeten, K.F. Boersma, J. Zörner, M.H.A., K.W. Bowman, J.S. Worden, M. George
Measuring changes in tropospheric ozone • Tropospheric ozone is an air pollutant and a greenhouse gas with largelocal varying impacts on human health and vegetation. • Ozone increased at many background locations in the 1990s. It continued mainly over Asia and flattened over Europe during the last decade. • Assessing changes in ozone and in trends are difficult due to scarcity of long-term measurement sites in combination with relatively short lifetime of ozone and the meteo influence leading to local large variations. • Satellite observations can cope better with both the spatial as well as temporal varying nature of tropospheric ozone compared to ozone sondes, ground-based instruments, MOZAIC etc. IPCC 2012
Measuring changes in tropospheric ozone t TES • Motivation of this study • Is TES (Tropospheric Emission Spectrometer) a good instrument to detect tropospheric ozone variations in space and time? • => Validation of tropospheric ozone with sonde data (2005-2010) • => Evaluation of temporal stability of the instrument for change detection of tropospheric ozone (2005-2010)
TES: Tropospheric Emission Spectrometer JJA 2005-2010 464 hPa
TES: Tropospheric Emission SpectrometerValidation of TES tropospheric ozonewith sondes • TES: on board NASA EOS-Aura satellite (operational 2004-now) • Detects infrared radiation upwelling from Earth’s atmosphere • Ozone retrieval around 9.6 μm (3.3-15.4 µm) band • Pixel 5.3 × 8.3 km2 • Sensitive to ozone in the free troposphere • Sonde – TES: temporal and spatial coincidence criteria: ±300 km and ±9 hrs (Nassar et al., 2008) • TES version 4: 2005-2010 & WOUDC data: 4460 data pairs • All sonde data interpolated to a fine level pressure grid (800 levels from 1260 hPa to 0.46 hPa) • Mapping matrix to interpolate to the 67 pressure level TES grid (from 1212 to 0.1 hPa).
Validation of TES tropospheric ozone data with sondes • Accounting for TES sensitivity and vertical resolution to the sonde data: applying the TES operator (TES averaging kernel & a priori constraint vector): • This is the profile that would be retrieved from TES for the same air sampled by the sonde in the absence of other errors.
Validation of TES tropospheric ozone data with sondes • Spatial distribution of used sonde data for TES validation • Most TES-sonde datapairs are found in NH, especially at Mid-lattitudes
TES sonde vertical ozone profiles at different latitudes TES is generally biased high within the troposphere over all latitude zones by up to 10 ppbv, corresponding to relative differences up to +15%. For cold Antarctic and Arctic: next-to-zero sensitivity of TES to ozone; TES holds mainly the a priori information. Lower troposphere biases (Surface -500 hPa): 5 (Tropics) -7 ppbv (Mid lat) Higher troposphere biases (500 - tropopause): 3 – 10 ppbv. Verstraeten et al., AMTD
Spatial patterns in TES-sonde FTO biases ~7.0 ppb ~4.0 ppb ~2.5 ppb ~3.5 ppb 464 hPa 35/56˚N 15/35˚N -15/15˚N -56/-15˚N
Trend in TES-Sonde ozone biases? NMLT No significant trends found in the TES-Sonde bias. BIAS for NMLT at 464 hPa: ~7 ppb
Trend in TES-Sonde ozone biases? No! Long-term stability of the satellite retrievals is assured.
Free Tropospheric Ozone (FTO) trends 1 3 2 4 • Consequently, TES is an appropriate instrument for detecting changes and short-term trends in tropospheric ozone! => illustration for China 2005 2006 2007 2008 2009 2010 Increase of 1.18 ppb ozone at 464 hPa per year!!!
IASI: great promise IASI, 6km 15-31 August 2008: binned on 3 x 2 grid of TM5
Corresponding TM5 sampled to IASI characteristics 6km 15-31 August 2008: binned on 3 x 2 grid of TM5 IASI / TM5 ratio for China = 0.97±0.012 (range 0.90-0.99) . IASI 52.1±1.35 ppbv ---------- = ----------------------- TM5 54.5±1.01 ppbv
Preliminary comparison TES, 464hPa 15-31 August 2008: binned on 3 x 2 grid of TM5
Preliminary comparison Corresponding TM5, 464hPa 15-31 August 2008 TES / TM5 ratio for China = 1.03±0.065 (range 0.98-1.10) . TES 64.0±4.58 ppbv ---------- = ----------------------- TM5 62.7±4.41 ppbv
Conclusions TES – sonde free tropospheric ozone biases of version 4 are ~5-6 ppbv, up to 10 ppbv The TES – sonde free tropospheric ozone biases show no trends in time TES might be a good instrument for detecting changes and short-term trends Extending current TES satellite observations of (free) tropospheric ozone should be done: IASI shows great promise (preliminary analysis and dataset : IASI/TM5 ratio ~0.97)
Thank your for your attention! Questions? Remarks? Comments? Clarifications? Discussions? Hungry?!