Download
1 / 23
230 likes | 356 Views
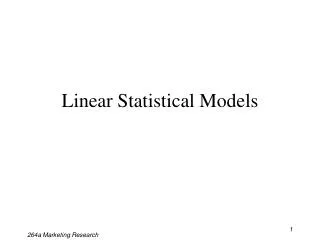
Statistical Models of Human Performance. I. Scott MacKenzie. What’s up?. “Statistical models of human performance” Definition – a fancy term for a very simple idea presented in this short presentation Such models lie at the numeric end of the Model of Models continuum presented earlier

E N D
Statistical Models of Human Performance I. Scott MacKenzie
What’s up? • “Statistical models of human performance” • Definition – a fancy term for a very simple idea presented in this short presentation • Such models lie at the numeric end of the Model of Models continuum presented earlier • These models of human performance are of three genres,1 namely models of… • Description • Relation • Prediction 1 Are there more than these three? Please let me know
Models of Description • This is simply a statistic that describes or summarizes a characteristic or performance of a group of participants on a controlled variable • E.g. mean • By far the most common “statistical model” • Calling this a “model” Is a stretch (but if a model is a “simplification of reality”, then descriptive statistics seem to apply) • Other examples • Standard deviation, minimum, maximum, median, skewness, kurtosis, event count, etc.
Descriptive Statistic Example • The performance of twelve participants was measured for two sizes of stylus-activated soft keyboards • Several performance measurements were made • Each performance measure is a dependent variable • One was “text entry speed” (with units “words per minute”) • The controlled variable (aka independent variable) is “keyboard size” • There were two sizes: large and small • Results for the small keyboard: (next slide)
Comparative Evaluations • The preceding result, in isolation, is not very interesting • Usually, the research question(s) involves comparing two or more conditions • The conditions are the levels of the controlled variable • In the example, the controlled variable is “keyboard size” and the levels are “small” vs. “large” • Results for entry rate: (next slide)
19.97 wpm 21.17 wpm We noted in the previous slide that comparative evaluations are more interesting. But, is this result more interesting? Answer #1 – No! … since there’s so little difference between the two conditions! Answer #2 – Yes! … since we might expect the smaller keyboard to be faster (because there is less stylus movement). It is not faster!
Models of Relation • The idea is that a relationship may exist between variables • If we can unearth such a relationship and quantify it, measure it, model it, this might be useful • It is an example of a priori knowledge • The relevant statistic is Pearson’s product-moment correlation, r, measured on the two sets of variables • r varies between –1 and +1 (next slide)
Perfect positive correlation “Some” positive correlation No correlation “Some” negative correlation Perfect negative correlation Correlation Statistic, r +1 0 -1
What Variables? • A variety of relationships are of interest • Both variables must be quantitative, either continuous (e.g., typing speed) or discrete (e.g., trial block) • Two categories of relationship are… • controlled variable vs. dependent variable • dependent variable vs. dependent variable • Let’s examine each
Controlled vs. Dependent Variable • This is the most common relationship of interest • The idea… Positive relationship Negative relationship Dependent Variable Dependent Variable Controlled Variable Controlled Variable
Controlled vs. Dependent Variables (2) • Examples of controlled variables • Age, computer experience, shoe size! • Target width, target distance, Fitts’ “index of difficulty” • Speed, accuracy (yes, these can be “controlled”) • Number of search keywords • Etc. • Examples of dependent variables • Speed (task completion time), accuracy • Number of retries, saccades • Search success (how is this measured?) • Etc.
Controlled vs. Dependent Variables (3) • Example: • Controlled variable: Movement amplitude (A) • Dependent variable: Movement time (MT) • Task: • Select a target, given various settings for A A = 100 A = 200 A = 400 More on this example later!
Two Dependent VariablesExample #1 • Dependent variable: Speed • Dependent variable: Accuracy • The speed-accuracy tradeoff is a well-studied phenomenon (if humans act fast, they are less accurate; slow down and accuracy improves) • Example task: • Text entry using a stylus and “unistrokes with word completion” (the details are not important here) • Result: (next slide)
r = -.3658 Modest negative correlation • Notes: • Each point is for one participant, based on about 25 phrases of input. • It appears faster participants had a slight tendency to commit less errors. • What if accuracy was “controlled”, and we had several data points for each participant, such as ER = 0%, 1%, 2%, 3%, 4%, etc.?
Two Dependent VariablesExample #2 • Here’s a research question for the stylus-activated soft keyboard presented earlier • Is there a relationship between users’ touch typing speed and their stylus tapping speed? (In other words, does skill in touch typing correlate with stylus-tapping speed? Reasonable arguments exist either way.) • Thus, the relationship of interest is between two dependent variables: • Dependent variable: touch typing speed • Dependent variable: stylus tapping speed • To investigate this, participants’ touch typing speed was also measured • Results for small keyboard: (next slide)
There is a modest positive correlation between the variables. Participants who are fast touch typists tend to be fast in using a stylus-activated soft keyboard.
Models of Prediction • The idea: • Build a prediction equation,where the outcome on a dependent variable is predicted from the settings on one or more controlled variables • Typically… • such models are built using regression (in statistical terms, regressing the measures for the dependent variable on the settings for the independent variable) • The result is… • a regression equation, usually linear, of the form y = mx + b (m is the slope, b is the intercept) • An accompanying statistic is… • R2 (the square of r), interpreted as the amount of variation in the dependent variable that is explained by the prediction model
Models of Predictions (2) • Results of regressing the stylus entry speed points on the touch typing entry speed1 points: (next slide) 1 Here we consider touch typing speed a controlled variable. This makes sense, since touch typing speed may be regarded as an existing skill used to predict the outcome on a different, but related, task.
Stylus typing speed = 0.134 x touch typing speed + 15.0 But… explains only 27.3% of the variation in observations. Not a particularly good model
Summary • We have suggested that statistical models of human performance are of three genres, namely models of… • Description • Relation • Prediction • …and a examples of each were given
Related • Relationships may be non-linear • Regression models can be built using non-linear equations, such as power functions • Multiple regression models are also possible • In this case the prediction equation includes more than one controlled variable (see MacKenzie and Ware, 1983, for an example)
Thank You • References • MacKenzie, I. S., & Zhang, S. X. (2001). An empirical investigation of the novice experience with soft keyboards. Behaviour & Information Technology, 20, 411-418. • MacKenzie, I. S., & Ware, C. (1993). Lag as a determinant of human performance in interactive systems. Proceedings of the ACM Conference on Human Factors in Computing Systems - INTERCHI '93, 488-493. New York: ACM.