Download
1 / 22
220 likes | 377 Views
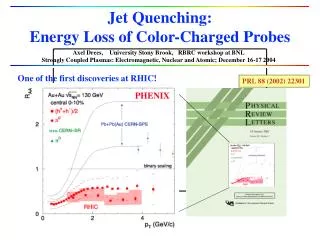
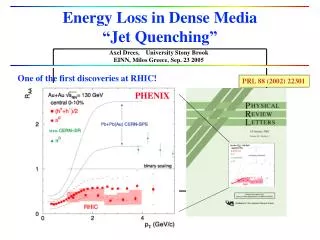
Jet fragmentation in A+A collisions Andrew Adare University of Colorado for the PHENIX Collaboration. Energy loss and modified jet fragmentation. Experimental observation: Hadronic jet fragmentation products suffer suppressed yields in A+A collisions.

E N D
Jet fragmentation in A+A collisionsAndrew AdareUniversity of Coloradofor thePHENIX Collaboration
Energy loss and modified jet fragmentation Experimental observation: Hadronic jet fragmentation products suffer suppressed yields in A+A collisions. Example of quenched vs. unquenched frag. function This suppression reflects energy loss by hard-scattered partons, and a softened fragmentation function. Z
Probing E-loss at high pT: RAA vs. correlations • RAA suggests large energy loss, but can’t get to P(DE). • Study of correlated particles adds spatial and kinematic information on high-pT jet quenching. • High-pT jet correlation observables characterize Width Shape Yield T. Renk Phys.Rev.C77:017901,2008. Suppressed hadron cross-section (~RAA) Hard-scattering x-section E-loss prob. Vacuum D(Z) How do these quantities depend on energy and system size? Au+Au di-hadron 1/Ntrig dNpair/d(Df)
pT evolution of dihadron correlations • Trends: • As pT increases, • Double-peak single peak • Away-side yield drops • Head region yield begins to dominate over shoulder region arXiv:0801.4545 [nucl-ex] (yields normalized over Df) See poster P54 by J. Jia
RHS in di-hadron correlations arXiv:0801.4545 [nucl-ex] Would shoulder-dominated head-dominated transition still occur at higher trigger pT? For high-pT triggers, Au+Au shape approaches p+p with growing pT
Pushing to high pTin Au+Au p0-h • “Zooming in” with 7-9 GeV p0s • Good reconstruction efficiency • Good p0 S/B (> 5) • 3x statistics in Run 7 vs. Run 4 • Measured RMS width and RHS *Not corrected for h± efficiency PHENIX preliminary Higher pT / more peripheral
RHS vs. partner pT RHS > 1 in all bins similar to p+p 200 GeV di-hadron RHS 10 1 partner pT [GeV/c] Dip/rise trend in RHS not observed at higher pT 5-10 GeV trigger pT bin dominated by low range Onset of vacuum fragmentation at trigger pT > ~7 GeV
Near side h-h correlations:p+p / Au+Au widths • p+p and Au+Au near-side widths agree closely at high pT arXiv:0801.4545 [nucl-ex]
p0-h at high pT: near side • Near-side RMS width • No significant centrality dependence
p0-h at high pT: Away side • Away side RMS width: • Comparable to p+p; again, centrality-independent p+p p0-h: 6.5-8 x 1.4-5 away width = 0.350 ± 0.03 (Phys Rev D 74 072002)
But broadening was predicted Phys. Lett. B 630 (2005) Vitev: Large angle gluon radiation Collinear gluon emission is suppressed Significant enhancement of peak width J.Phys.G34:S675-S678,2007 Polosa and Salgado: Radiation-induced shoulder enhancement Nucl.Phys.A783:493-496,2007 Ejet = 7 GeV Wicks et al: Collisional E-loss also non-negligible! Multi-scattering leads to broadening
STAR hasn’t reported broadening either 8 < pT(trig) < 15 GeV/c pT(assoc)>6 GeV nucl-ex/0604018 M. Van Leeuwen, QM06
Understanding the width discrepancy • Some possibilities: • Theorists are overpredicting E-loss • High pT dijets don’t probe the medium Sizable P(DE) fluctuations we observe mainly punch-thru Geometric bias we observe primarily surface emission PRL 98 212301, 2007 tangential emmision reaction plane punch- through
What about the jet pair yields? • Gluon radiation also affects yields: • R(2)AA = IAA = (A+A / p+p) integrated jet yield ratio • Suppression predicted at high partner pT, • enhancement at low pT I. Vitev, Phys. Lett. B 630 (2005)
Au+Au Away sideyield modification • IAA for head and head/shoulder regions Strong partner pT dependence: High pT suppression / low pT enhancement occurs as predicted. Jet energy redistribution via jet-medium interactions: SR more enhanced than HR. Why? Could be Widening of head component (incoherent rad. / collisional E-loss) Mach/cherenkov energy transfer (coherent rad.) arXiv:0801.4545 [nucl-ex]
An additional probe:Fragmentation photons NLO g’s - bremss. and jet fragmentation May be enhanced in A+A from medium-induced bremsstrahlung Near-side integrated yield of fragmentation photons: Brand newmeasurement in p+p baseline Near-side gfrag yields in A+A will add new information on fragmentation modification.
Other prospects for tighter constraints • Higher Au+Au stats now available for analysis finer binning to pin down shape evolution • 2+1 Correlations Increase prob. that away side parton traverses medium. See H. Pei’s talk • g+jet challenging, but nice progress, see M. Nguyen’s talk trigger partner additional away-side particle
What did we learn? • At trigger pT > 7 GeV, jet shapes and widths are p+p-like • suggests vacuum fragmentation • Challenges models predicting jet broadening • BUT: • We may mostly observe the hadronized partons that passed through the medium with little/no interaction, • or didn’t pass through the bulk of the medium at all. • Jet yield measurements suggest energy transfer through the medium, in agreement with E-loss predictions. • Dijets are an important step towards QGP tomography • Shape/yield studies augment RAA • New data, new analysis technology inspires optimism!
ZYAM subtraction applied to measured, high, and low v2 curves Resulting variation taken as systematic error Examples Top: High/low CF fit curves shown after ZYAM applied Bottom: Error boxes from v2 and ZYAM uncertainty. ZYAM/flow systematics