Download
1 / 26
260 likes | 341 Views
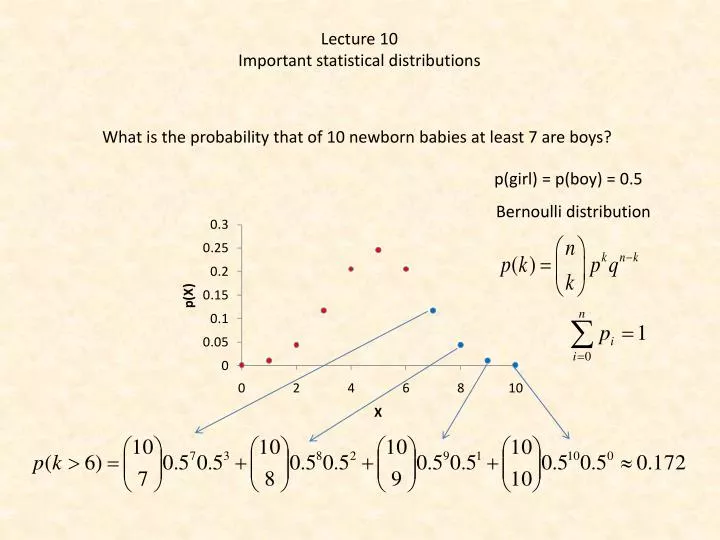
Lecture 10 Important statistical distributions. What is the probability that of 10 newborn babies at least 7 are boys ? . p(girl) = p(boy) = 0.5. Bernoulli distribution. Bernoulli or binomial distribution.

E N D
Lecture10 Importantstatisticaldistributions Whatistheprobabilitythat of 10 newbornbabiesatleast7 areboys? p(girl) = p(boy) = 0.5 Bernoulli distribution
Bernoulli orbinomialdistribution The Bernoulli orbinomialdistributioncomesfromthe Taylor expansion of thebinomial
Assume the probability to find a certain disease in a tree population is 0.01. A bio-monitoring program surveys 10 stands of trees and takes in each case a random sample of 100 trees. How large is the probability that in these stands 1, 2, 3, and more than 3 cases of this disease will occur? Mean, variance, standard deviation
What happens if the number of trials n becomes larger and larger and p the event probability becomes smaller and smaller. Poisson distribution Thedistributionorrareevents
Assume the probability to find a certain disease in a tree population is 0.01. A bio-monitoring program surveys 10 stands of trees and takes in each case a random sample of 100 trees. How large is the probability that in these stands 1, 2, 3, and more than 3 cases of this disease will occur? Bernoulli solution Poisson solution Theprobabilitythat no infectedtree will be detected Bernoulli solution Theprobability of morethanthreeinfectedtrees
Variance, mean Skewness
Whatistheprobabilityin Duży Lotek to havethreetimescumulationifthe first time 14 000 000people bet, thesecond time 20 000 000, and the third time 30 000 000? Theprobability to win is The zero term of the Poisson distributiongivestheprobability of no event Theprobability of atleast one event: Theeventsare independent:
The construction of evolutionarytreesfrom DNA sequence data Probabilities of DNA substitution We assumeequalsubstitutionprobabilities. Ifthetotalprobability for a substitutionis p: p A T p p p C G p p(A→T)+p(A→C)+p(A→G)+p(A→A)=1 Theprobabilitythat A mutates to T, C, or G is P¬A=p+p+p Theprobability of no mutationis pA=1-3p Independent events Independent events Theprobabilitythat A mutates to T and C to G is PAC=(p)x(p)
Theprobabilitymatrix T A C G A T C G Whatistheprobabilitythatafter 5 generations A did not change? TheJukes - Cantor model (JC69) nowassumesthatallsubstitutionprobabilitiesareequal.
TheJukes Cantor model assumes equalsubstitutionprobabilities within these 4 nucleotides. Arrhenius model Substitutionprobabilityafter time t A,T,G,C A Transitionmatrix t Theprobabilitythatnothingchangesisthe zero term of the Poisson distribution Substitutionmatrix Theprobability of atleast one substitutionis Theprobability to reach a nucleotidefromanyotheris Theprobabilitythat a nucleotidedoesn’tchangeafter time t is
Probability for a single difference Whatistheprobability of n differencesafter time t? We usetheprinciple of maximumlikelihood and the Bernoulli distribution This is the mean time to get x different sitesfrom a sequence of n nucleotides. It is also a measure of distance that dependents only on the number of substitutions
Homo sapiens Gorilla Pan paniscus Pan troglodytes Homo neandertalensis Phylogenetic treesarethebasis of anysystematicclassificaton Time Divergence - number of substitutions
A pile model to generatethebinomial. Ifthenumber of stepsisvery, verylargethebinomialbecomessmooth. Abraham de Moivre (1667-1754) Thenormaldistributionisthecontinousequivalent to thediscrete Bernoulli distribution
The central limit theorem If we have a series of random variatesXn, a new random variateYn that is the sum of all Xn will for n→∞ be a variate that is asymptotically normally distributed.
ThenormalorGaussiandistribution Mean: m Variance: s2
Important features of the normal distribution • The function is defined for every real x. • The frequency at x = m is given by • The distribution is symmetrical around m. • The points of inflection are given by the second derivative. Setting this to zero gives
0.68 +s -s 0.95 +2s -2s Many statisticaltestscompareobservedvalueswiththose of the standard normaldistribution and assigntherespectiveprobabilities to H1.
TheZ-transform Thevariate Z has a mean of 0 and andvariance of 1. The standard normal A Z-transformnormalizeseverystatisticaldistribution. Tables of statisticaldistributionsarealwaysgiven as Z-transforms. The 95% confidence limit
TheZ-transformed (standardized) normaldistribution 0.68 +s -s 0.95 +2s -2s P(m - s < X < m + s) = 68% P(m - 1.65s < X < m + 1.65s) = 90% P(m - 1.96s < X < m + 1.96s) = 95% P(m - 2.58s < X < m + 2.58s) = 99% P(m - 3.29s < X < m + 3.29s) = 99.9% TheFisheriansignificancelevels
Why is the normal distribution so important? The normal distribution is often at least approximately found in nature. Many additive or multiplicative processes generate distributions of patterns that are normal. Examples are body sizes, intelligence, abundances, phylogenetic branching patterns, metabolism rates of individuals, plant and animal organ sizes, or egg numbers. Indeed following the Belgian biologist Adolphe Quetelet (1796-1874) the normal distribution was long hold even as a natural law. However, new studies showed that most often the normal distribution is only a approximation and that real distributions frequently follow more complicated unsymmetrical distributions, for instance skewed normals. The normal distribution follows from the binomial. Hence if we take samples out of a large population of discrete events we expect the distribution of events (their frequency) to be normally distributed. The central limit theorem holds that means of additive variables should be normally distributed. This is a generalization of the second argument. In other words the normal is the expectation when dealing with a large number of influencing variables. Gauß derived the normal distribution from the distribution of errors within his treatment of measurement errors. If we measure the same thing many times our measurements will not always give the same value. Because many factors might influence our measurement errors the central limit theorem points again to a normal distribution of errors around the mean. In the next lecture we will see that the normal distribution can be approximated by a number of other important distribution that form the basis of important statistical tests.
Theestimation of thepopulationmeanfrom a series of samples x,s x,s x,s x,s x,s x,s x,s x,s The n samplesfrom an additive random variate. Z isasymptoticallynormallydistributed. m,s Standard error Confidence limit of theestimate of a meanfrom a series of samples. aisthedesiredprobabilitylevel.
How to apply the normal distribution Intelligence is approximately normally distributed with a mean of 100 (by definition) and a standard deviation of 16 (in North America). For an intelligence study we need 100 persons with an IO above 130. How many personsdo we have to test to find this number if we take random samples (and do not test university students only)?
One and two sided tests We measure blood sugar concentrations and know that our method estimates the concentration with an error of about 3%. What is the probability that our measurement deviates from the real value by more than 5%?
Albinos are rare in human populations. Assume their frequency is 1 per 100000 persons. What is the probability to find 15 albinos among1000000 persons? =KOMBINACJE(1000000,15)*0.00001^15*(1-0.00001)^999985 = 0.0347
Home work and literature • Refresh: • Bernoulli distribution • Poisson distribution • Normaldistribution • Central limit theorem • Confidencelimits • One, twosidedtests • Z-transform • Prepare to thenextlecture: • c2 test • Mendel rules • t-test • F-test • Contingencytable • G-test Literature: Łomnicki: Statystyka dla biologów Mendel: http://en.wikipedia.org/wiki/Mendelian_inheritance Pearson Chi2 test http://en.wikipedia.org/wiki/Pearson's_chi-square_test