Download
1 / 42
420 likes | 545 Views
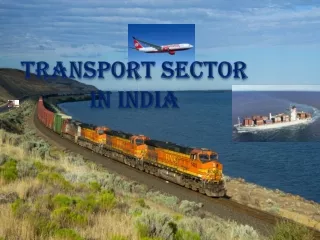
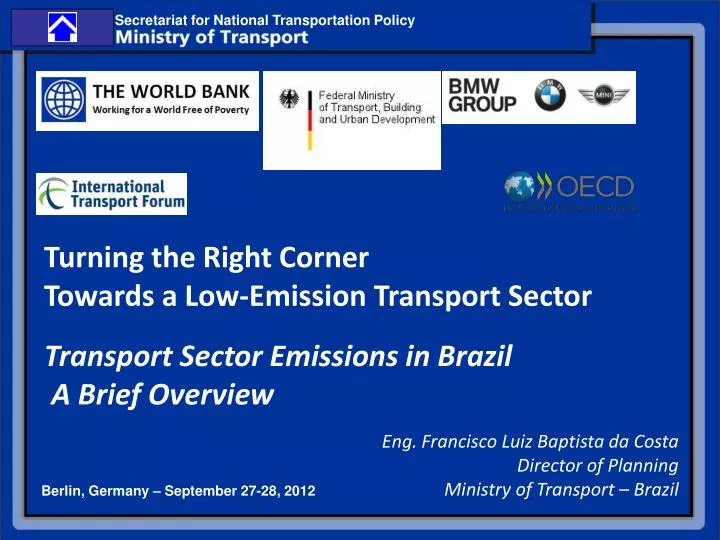
Turning the Right Corner Towards a Low-Emission Transport Sector. Transport Sector Emissions in Brazil A Brief Overview. Eng. Francisco Luiz Baptista da Costa Director of Planning Ministry of Transport – Brazil. Berlin, Germany – September 27-28, 2012. Summary. Basic Information

E N D
Turning the Right Corner Towards a Low-Emission Transport Sector Transport Sector Emissions in Brazil A Brief Overview Eng. Francisco Luiz Baptista da Costa Director of Planning Ministry of Transport – Brazil Berlin, Germany – September 27-28, 2012
Summary • Basic Information • Vehicle Emissions • Regional & National Transport • Urban Transport
Summary • Basic Information • Vehicle Emissions • Regional & National Transport • Urban Transport
Basic Information • Transport sector in Brazil has a lower carbon intensity compared to that of other countries because of the widespread use of ethanol as a fuel for vehicles. • In 2008, the Transport sector emissions were about 149 Mt CO2e, representing 12 percent of national emissions. • Urban Transport accounts for about 51 percent of direct sector emissions in 2008. • Source: Brazil Low-carbon Country Case Study – World Bank, 2010
100% 2 4 5 1 90% Other 80% 38 41 Coal 70% 60% Hydraulic 85 12 50% 16 Nuclear 40% 23 15 30% Gas 20% 20 20 Petroleum 10% 3 3 6 4 3 0% BRAZIL 2007 OECD2006 WORLD % renewable 483 TWh - 89% 10,460 TWh - 16% 18,930 TWh - 18% Source: MME The Brazilian power generation matrix is clean, based on hydro-electric plants. It is required to make this feature compatible with navigation needs Power Generation Matrix – Brazil and the World (%)
Summary • Basic Information • Vehicle Emissions • Regional & National Transport • Urban Transport
PROALCOOL • – PROALCOOL (National Program for Alcohol) • To substitute gasoline for ethanol in automobiles • 1977 – 4.5% ethanol in gasoline (lead free) • 1979 – 15% ethanol in gasoline • 1979 – First Brazilian car powered by ethanol only • 1985 – 22% ethanol in gasoline • 92% of cars sold are ethanol powered • 1993 – 25% ethanol in gasoline
PROALCOOL (cont’d) • 2003 – First Brazilian car flex-fuel (ethanol – gasoline in any proportion) • 2012 – 100% of cars made in Brazil are flex-fuel • 2005 – National Program for Production and Use of Biodiesel • 2005-2008 – 2% biodiesel in standard diesel • 2009-2010 – 4% biodiesel in standard diesel • 2010-now – 5% biodiesel in standard diesel
PROCONVE • 1986 – Program establishing parameters for vehicle emissions • Phase L – “light” vehicles (< 2.7 tons) • L 1 – 1988 to 1991 • L 2 – 1992 to 1996 • L 3 – 1997 to 2004 • L 4 – 2005 to 2008 • L 5 – 2009 to 2013 • Phase P – “heavy” vehicles (> 2.7 tons) • P 1 & P 2 – 1990 to 1993 • P 3 – 1994 to 1997 • P 4 – 1998 to 2002 • P 5 – 2003 to 2008 • P 6 – 2009 to 2011 (cancelled due to lack of diesel S 500 and S 50) • P 7 – 2012 to 2016
Summary • Basic Information • Vehicle Emissions • Regional & National Transport • Urban Transport
Road Network In km
Rail Network National Rail Network 29,817 km Federal Rail Network under Concession 28,314 km 12 concessions operated by 5 private groupsand 2 state-owned companies
National Ports 50 public ports in Brazil – sea and river 26 Federal Port Companies and National Department for Transport Infrastructure (DNIT) 23 States and Municipalities 1 private sector
Inland Waterways 28,000 km of inland waterways Potential utilization of over 15,000 km of new waterways Transport of over 25 million tons / year Agricultural and mineral products, alcohol, construction material (sand, gravel), fertilizers Main Inland Waterways under operation Paraná – Tietê 1,660 km Amazonas - Madeira 4,164 km Tapajós 1,046 km Capim 372 km Tocantins – Araguaia 3,040 km * São Francisco 1,371 km Paraguai 1,323 km Jacuí - Taquari and Lagoa dos Patos 670 km TOTAL 13.646 km * Usable conditions
Inland Waterways system * Not necessarily continuous stretches.
The transport matrix is unbalanced considering the size of Brazil
Russia Canada Australia USA China Brazil 81% 8% 11% 46% 43% 11% 43% 53% 4% 43% 32% 25% 37% 50% 13% 25% 58% 17% Rail Road Water; others which is proved as compared with similar-size countries.
To organize such scenario and recover the transport sector, the Ministry of Transport has developed the National Plan for Logistics and Transportation (PNLT) An instrument for strategic organization with an integrated view on the territory and development. Transport as an agent to induce and facilitate development. A more balanced Brazilian transport matrix with a significant participation of rail and water modes, which are more efficient in terms of economy and energy consumption.
PNLT uses advanced planning techniques, studying the 80 most important products of the Brazilian economy, accounting for 90% of the GDP Macroeconomic Forecasting Tools EFES(*) Model FIPE/FEA/USP Multimodal Transport Simulation Models 558 homogeneous microrregions Institutional Products Investment Portfolio (*) EFES-Economic Forecasting Equilibrium System (160,000 equations, 600,000 variables) (**) Presently, the analysis is expanded to 110 products, including general cargo
Production Demand Each product was studied in terms of production, demand, domestic and export flows Main domestic transactions Example Soy beans Export
PNLT indicates ways to change the transport matrix Consolidation of a new Brazilian rail network (Law 11772/2008) with the implementation of 11,800 km of new rail lines, with 10,700 km of large-gauge tracks. New railways will serve areas of agricultural & mineral new frontiers. This new basic railway system prepares the Country for a new economic growth cycle to meet the domestic demand increase and integration with exporting ports. Gradual transfer of general cargo from roads to railways, inland waterways, and coastal shipping.
Projects for Railways Expansion in Brazil EF - 151 (Ferrovia Norte-Sul) Panorama/SP - Rio Grande/RS (1.600 km)
60 58 50 40 35 Road 30 Rail 29 30 25 Water Pipe 20 Air 13 10 3.6 5 1 0.4 0 2005 2015 2020 2025 Source: PNLT Processing, considering energy consumption Transport Matrix - Present and Future
EMISSÃO DE POLUENTES: EFICIÊNCIA ENERGÉTICA: Carga / Potência (t / HP) CONSUMO DE COMBUSTÍVEL: Litros / 1.000 tku Fonte: DOT/ Maritime Administration e TCL Fonte: Ministério dos Transportes - 1997
Benefits from the Transport Matrix change 2005 to 2023/2031 (Transport production from 851 to 1,510 bi TKU) 38% of energy efficiency increase 41% of fuel consumption reduction 32% of CO2 emission reduction 39% of NOx emission reduction
Long distance passengers transport • Bus transportation volumes stabilized in the last decade. • Air transportation increasing double-digit / year. • For the heavy passenger corridors in the Southeast: implementing a high speed train network.
High Speed Train Rio de Janeiro - São Paulo - Campinas Rio - São Paulo 450 km in 93 min São Paulo - Campinas 100 km in 30 min The most populous (36 millions inhabitants) and economically developed region (45% of GDP) in Brazil Estimated cost: US$ 20 billions Public & private sector financing Operation expected to begin in 2018
Future High Speed Train Lines • Segments already included in the Railway Law nº 11,772/2008, to be studied in the future • Campinas/SP – Belo Horizonte/MG: 530 km • São Paulo/SP – Curitiba/PR: 410 km • Campinas/SP – Triângulo Mineiro: 540 km
Summary • Basic Information • Vehicle Emissions • Regional & National Transport • Urban Transport
3 Major Events • 2014 – Soccer World Cup • Urban mobility projects in 12 large cities • 2016 – Olympic Games • Urban mobility projects in Rio de Janeiro • Law nº 12.587, January 3rd, 2012: National Policy for Urban Mobility – PNMU • Local mobility plans mandatory for cities larger than 20,000 inhabitants
Main projects to be implemented until 2020 • (not restricted to those 12 World Cup cities) • Expansion of infrastructure for public transport • BRT – 326 km • Bus corridors – 285 km • VLT – 57 km • Subway – 165 km • Urban trains – 71 km • Monorail – 63 km • Bikeways implementation • Bikeways – 330 km • Green buses (biodiesel, electric)