Download
1 / 41
540 likes | 1.02k Views
Human Population Growth. Basic concepts and human history. Human population has recently exploded in size Note large increase in late 20 th century . Human evolution. Changes in society cause changes in population. Human ancestor numbers

E N D
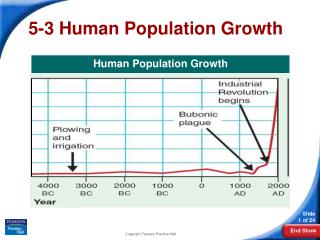
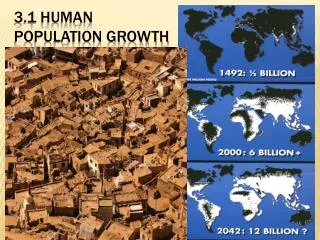
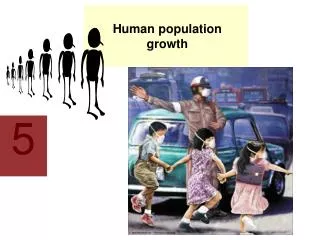
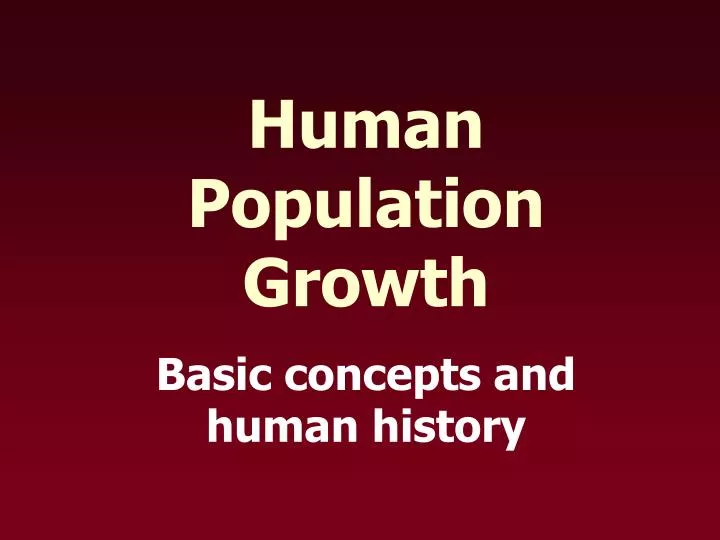
Human Population Growth Basic concepts and human history
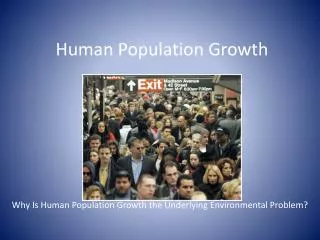
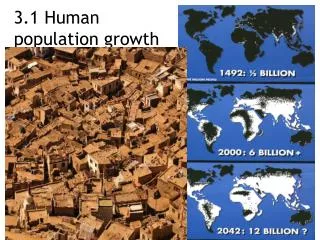
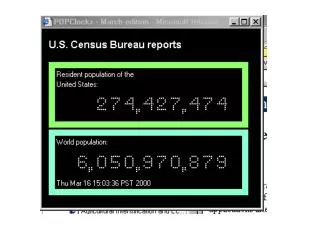
Human population has recently exploded in size Note large increase in late 20th century
Human evolution Changes in society cause changes in population Human ancestor numbers regulated by the environment like any other organism Homo sapienssapiens (modern humans) around 90,000 years old
Hunter-gatherers Small nomadic populations Short life expectancy (30-40 yrs.) LOW ENVIRON. IMPACTS Small numbers Frequent movements
Agricultural revolution Began 10,000 - 12,000 y.a. in the Middle East Fundamentally alters human civilization
Societal effects Ample food available Frees individuals from daily food gathering Craftsmen and artisans arise Class distinctions Better survival rates
Agricultural revolution Permanent settlements arise... Architecture improves... ...CITIES ARE BORN
POPULATION DENSITY: Populations remain in one location Ample food = population growth PEOPLE IN CITIES NEED: Fields for farming & grazing, water, wood, clay, minerals, etc. ENVIRONMENTAL IMPACTS: Increased human populations stress local environment This changes everything...
Menderes Valley in modern Turkey Erosion in river valley Overgrazing Over-farming Deforestation Delta into Aegean grows over time
Industrial revolution Begins in Europe in early 18th century CHANGES Agriculture Production Transportation SOCIETY
Industrial revolution STEAM POWER: Coal-fired Replaces water power Factories need not be near water Powers factories, railroads, sea travel
More food from less land with less labor END RESULT: Industrial revolution AGRICULTURE: Crop rotation - reduced fallow time Plowing and seeding techniques improved Root crops popularized Late 1800's inorganic fertilizer produced Mechanized farming and processing
END RESULT: Populations rise rapidly Industrial revolution SOCIAL CONSEQUENCES: Urbanization of population Plentiful food Medicine and sanitation reduce mortality Mass production improves quality of life
Revolutions and pop. growth Each of these revolutions raised the carrying capacity for humans Industrial – Scientific revolution Numbers of humans Agricultural revolution Tool-making revolution Time
Population growth curve A highly simplified and somewhat unrealistic growth model …eventually leveling off at the carrying capacity …then rapidly... CARRYING CAPACITY Maximum no. of a species the environment can support Number Population grows slowly... Time
Note the human population is still in the rapid growth phase Figure 3.12
THE BIG QUESTION: Where will the human population level off? http://www.unfpa.org/modules/6billion/facts.htm
QUESTION: How many humans can the earth support? 50 billion 2.5 billion Assumes: All open flat land cultivated Purely vegetarian diet People live underground Assumes: Current food production Typical American diet Human carrying capacity World grain production leveling off Population continues to increase Per-capita grain production necessarily declines Environmental impact starting to cause problems
BIRTH RATE: Births per unit time divided by population size b = birth rate B = number of births per unit time N = total population size b = B/N DEATH RATE: Deaths per unit time divided by population size d = death rate D = number of deaths per unit time N = total population size d = D/N GROWTH RATE: Rate of population change g = (B - D)/N Variables as above Calculating growth rate
Population of Australia in 1998 (N) = 18,700,000 Births from 1998-1999 (B) = 261,500 Deaths from 1998-1999 (D) = 130,900 b = 261,000/18,700,000 b = 0.014 b = 1.4% BIRTH RATE: b = B/N d = 130,900/18,700,000 d = 0.7% DEATH RATE: d = D/N GROWTH RATE: g = (B - D)/N g = (261,800 - 130,900)/18,700,000 g = 0.7% AN EXAMPLE:
Time it takes population size to double Varies depending on growth rate Roughly equal to 70 growth rate Even g =1% will double global population in your lifetime DOUBLING TIME Figure 5.5
Pop sizetime 2 = Pop sizetime 1 + (Pop sizetime 1 * growth ratetime1) N2 = N1 *(1+ g1) Using the previous example: Population of Australia in 1998 (N1) = 18,700,000 Growth rate of Australia in 1998 (g1) = 0.7% or 0.007 Population of Australia in 1999 (N2) = ? N2 = 18,700,000 *(1.000 +0.007) N2 = 18,700,000 + 130,900 N2 = 18,830,900 POPULATION GROWTH:
Large population = rapid increase High growth rate = rapid increase Therefore: Population size China = 1,220,000,000 people x 1% growth = +12,200,000 per yr Japan = 126,000,000 people x 1% growth = + 1,260,000 per yr Growth rate Japan =126,000,000 people x 1% growth = + 1,260,000 per yr Japan =126,000,000 people x 10% growth = + 12,600,000 per yr FACTORS AFFECTING POPULATION GROWTH N2 = N1 *(1 + g1) Population increase affected by population size and growth rate
The two worlds DEVELOPED COUNTRIES: High Gross National Product High per-capita GNP STATS: 21% of global pop. Holds 85% of global wealth Use 88% of global resources Generate 75% of global pollution
The two worlds DEVELOPING COUNTRIES: Low Gross National Product Very low per-capita GNP STATS: 79% of global pop. Holds 15% of global wealth Little industrialization
Trends in global wealth 1 in 5 people live in luxury 3 in 5 people "get by" 1 in 5 people live in dire poverty How is the distribution of wealth changing?
THE FORMULA: P x A x T = Environ. Impact Population x Affluence x Technology = Impact Number of people number of resource “units” used per person Environmental impact per resource unit used Calculating environ. impacts A differs in developed and developing countries T by some technology (e.g., burning coal) T by some technology (e.g., solar power)
Magnitude = width of circle P x A x T = Environ. Impact Developing nations = x x number of resource “units” used per person Env. impact per resource unit used Number of people Env. impact of population = x x Developed nations
Where are populations increasing? Figure 5.3
Geography and growth Figure 5.3c
Age structure diagrams Figure 5.9
Population increases Rapid increases in population in 20th century Growth rate = births - deaths Growth increased by births or deaths So which caused the recent increase in population?
Developed countries Natural rate of increase Birth rate-death rate Both rates decline in 20th century Rate of increase stable
Developing countries Natural rate of increase Death rates decline sharply Birth rates do not follow Rate of increase skyrockets
Why the drop in death rates? Improvements in sanitation reduce incidence of disease Industrialized agriculture gives higher yields, better nutrition Antibiotics and better medicine reduce death rates
What influences birth rates? FACTORS THAT AFFECT FERTILITY RATES: Education and affluence Cost of children Urbanization Infant mortality State pensions Female education and employment Women's age at marriage Availability to birth control Importance of child labor How will each of these factors affect birth rates?
No. of kids per couple to replace themselves in the population Developed = 2.1 and Developing = 2.6 in 1996 TOTAL FERTILITY RATE: Estimate of the no. of children a woman has in her lifetime Developed = 1.6 and Developing = 3.4 in 1996 Global average = 3.0 "Magic number" = 2.1 Measuring fertility rates REPLACEMENT LEVEL FERTILITY:
THE GOAL: Get global TFR 2.1 for zero population growth (ZPG) METHODS: Affluence and industrialization Slowing population growth Increased access to birth control Increased opportunities for women Economic incentives to reduce family size