Download
1 / 27
280 likes | 992 Views
Exponential Functions and Models. Lesson 5.3. Contrast. Definition. An exponential function Note the variable is in the exponent The base is a C is the coefficient, also considered the initial value (when x = 0). Explore Exponentials.

E N D
Exponential Functions and Models Lesson 5.3
Definition • An exponential function • Note the variable is in the exponent • The base is a • C is the coefficient, also considered the initial value (when x = 0)
Explore Exponentials • Given f(1) = 3, for each unit increase in x, the output is multiplied by 1.5 • Determine the exponential function
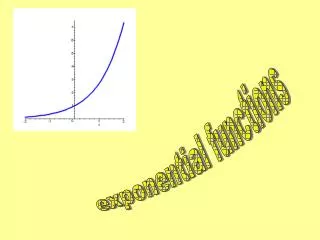
Explore Exponentials • Graph these exponentials • What do you think the coefficient C and the base a do to the appearance of the graphs?
Contrast Linear vs. Exponential • Suppose you have a choice of two different jobs at graduation • Start at $30,000 with a 6% per year increase • Start at $40,000 with $1200 per year raise • Which should you choose? • One is linear growth • One is exponential growth
Which Job? • How do we get each nextvalue for Option A? • When is Option A better? • When is Option B better? • Rate of increase a constant $1200 • Rate of increase changing • Percent of increase is a constant • Ratio of successive years is 1.06
Example • Consider a savings account with compounded yearly income • You have $100 in the account • You receive 5% annual interest View completed table
Compounded Interest • Completed table
Compounded Interest • Table of results from calculator • Set Y= screen y1(x)=100*1.05^x • Choose Table (♦Y) • Graph of results
Assignment A • Lesson 5.3A • Page 415 • Exercises 1 – 57 EOO
Compound Interest • Consider an amount A0 of money deposited in an account • Pays annual rate of interest r percent • Compounded m times per year • Stays in the account n years • Then the resulting balance An
Exponential Modeling • Population growth often modeled by exponential function • Half life of radioactive materials modeled by exponential function
Growth Factor • Recall formulanew balance = old balance + 0.05 * old balance • Another way of writing the formulanew balance = 1.05 * old balance • Why equivalent? • Growth factor: 1 + interest rate as a fraction
Decreasing Exponentials • Consider a medication • Patient takes 100 mg • Once it is taken, body filters medication out over period of time • Suppose it removes 15% of what is present in the blood stream every hour Fill in the rest of the table What is the growth factor?
Decreasing Exponentials • Completed chart • Graph Growth Factor = 0.85 Note: when growth factor < 1, exponential is a decreasing function
Solving Exponential Equations Graphically • For our medication example when does the amount of medication amount to less than 5 mg • Graph the functionfor 0 < t < 25 • Use the graph todetermine when
General Formula • All exponential functions have the general format: • Where • A = initial value • B = growth rate • t = number of time periods
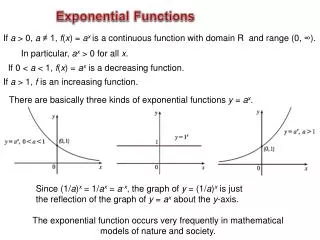
Typical Exponential Graphs • When B > 1 • When B < 1
Using e As the Base • We have used y = A * Bt • Consider letting B = ek • Then by substitution y = A * (ek)t • Recall B = (1 + r) (the growth factor) • It turns out that
Continuous Growth • The constant k is called the continuous percent growth rate • For Q = a bt • k can be found by solving ek = b • Then Q = a ek*t • For positive a • if k > 0 then Q is an increasing function • if k < 0 then Q is a decreasing function
Continuous Growth • For Q = a ek*t Assume a > 0 • k > 0 • k < 0
Continuous Growth • For the functionwhat is thecontinuous growth rate? • The growth rate is the coefficient of t • Growth rate = 0.4 or 40% • Graph the function (predict what it looks like)
Converting Between Forms • Change to the form Q = A*Bt • We know B = ek • Change to the form Q = A*ek*t • We know k = ln B (Why?)
Continuous Growth Rates • May be a better mathematical model for some situations • Bacteria growth • Decrease of medicine in the bloodstream • Population growth of a large group
Example • A population grows from its initial level of 22,000 people and grows at a continuous growth rate of 7.1% per year. • What is the formula P(t), the population in year t? • P(t) = 22000*e.071t • By what percent does the population increase each year (What is the yearly growth rate)? • Use b = ek
Assignment B • Lesson 5.3B • Page 417 • Exercises 65 – 85 odd