Download
1 / 37
450 likes | 1.07k Views
LESSON 8: RANDOM VARIABLES EXPECTED VALUE AND VARIANCE. Outline Random variables Probability distributions Expected value Variance and standard deviation of a random variable. RANDOM VARIABLES. Random variable:

E N D
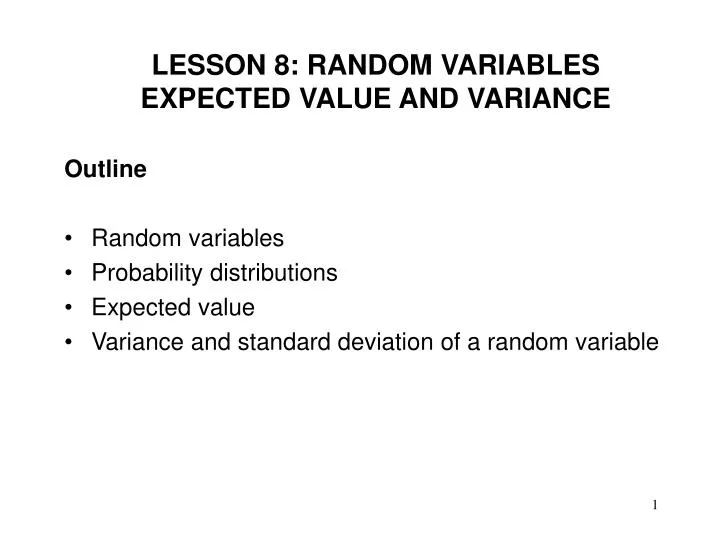
LESSON 8: RANDOM VARIABLES EXPECTED VALUE AND VARIANCE Outline • Random variables • Probability distributions • Expected value • Variance and standard deviation of a random variable
RANDOM VARIABLES • Random variable: • A variable whose numerical value is determined by the outcome of a random experiment • Discrete random variable • A discrete random variable has a countable number of possible values. • Example • Number of heads in an experiment with 10 coins • If X denotes the number of heads in an experiment with 10 coins, then X can take a value of 0, 1, 2, …, 10
RANDOM VARIABLES • Other examples of discrete random variable: number of defective items in a production batch of 100, number of customers arriving in a bank in every 15 minute, number of calls received in an hour, etc. • Continuous random variable • A continuous random variable can assume an uncountable number of values. • Examples • The time between two customers arriving in a bank, the time required by a teller to serve a customer, etc.
DISCRETE PROBABILITY DISTRIBUTION • Discrete probability distribution • A table, formula, or graph that lists all possible events and probabilities a discrete random variable can assume • An example is shown on the next slide. • Suppose a coin is tossed twice. The events • HH: both head • 1H1T: One head, one tail • TT: both tail
DISCRETE PROBABILITY DISTRIBUTION 0.75 0.5 0.25 Probability 0 HH 1H1T TT Event
HISTOGRAM OF RANDOM NUMBERS • Suppose that the following is a histogram of 40 random numbers generated between 0 and 1.
RANDOM NUMBER GENERATION • Most software can generate discrete and continuous random numbers (these random numbers are more precisely called pseudo random numbers) with a wide variety of distributions • Inputs specified for generation of random numbers: • Distribution • Average • Variance/standard deviation • Minimum number, mode, maximum number, etc.
RANDOM NUMBER GENERATION • Next 4 slides • show histograms of random numbers generated and corresponding input specification. • observe that the actual distribution are similar to but not exactly the same as the distribution desired, such imperfections are expected • methods/commands used to generate random numbers will not be discussed in this course
RANDOM NUMBER GENERATION: EXAMPLE • A histogram of random numbers: uniform distribution, min = 500 and max = 800 Uniform Distribution 25 20 15 Frequency 10 5 0 500 520 540 560 580 600 620 640 660 680 700 720 740 760 780 800 Random Numbers
RANDOM NUMBER GENERATION: EXAMPLE • A histogram of random numbers: triangular distribution, min = 3.2, mode = 4.2, and max = 5.2
RANDOM NUMBER GENERATION: EXAMPLE • A histogram of random numbers: normal distribution, mean = 650 and standard deviation = 100
RANDOM NUMBER GENERATION: EXAMPLE • A histogram of random numbers: exponential distribution, mean = 20
CONTINUOUS PROBABILITY DSTRIBUTION • Continuous probability distribution • Similar to discrete probability distribution • Since there are uncountable number of events, all the events cannot be specified • Probability that a continuous random variable will assume a particular value is zero!! • However, the probability that the continuous random variable will assume a value within a certain specified range, is not necessarily zero • A continuous probability distribution gives probability values for a range of values that the continuous random variable may assume
f(x) z CONTINUOUS PROBABILITY DSTRIBUTION
f(x) z CONTINUOUS PROBABILITY DSTRIBUTION
f(x) z CONTINUOUS PROBABILITY DSTRIBUTION • The Probability Density Function • The probability that a continuous random variable will fall within an interval is equal to the area under the density curve over that range a b
CONTINUOUS PROBABILITY DSTRIBUTION Example 1: Consider the random variable X having the following probability density function: Plot the probability density curve and find
EXPECTED VALUE AND VARIANCE • It’s important to compute mean (expected value) and variance of probability distribution. For example, • Recall from our discussion on random variables and random numbers that if we want to generate random numbers, it may be necessary to specify mean and variance (along with the distribution) of the random numbers. • Suppose that you have to decide whether or not to make an investment that has an uncertain return. You may like to know whether the expected return is more than the investment.
EXPECTED VALUE • The expected value is obtained as follows: • E(X) is the expected value of the random variable X • Xi is the i-th possible value of the random variable X • p(Xi) is the probability that the random variable X will assume the value Xi
EXPECTED VALUE: EXAMPLE Example 2: Hale’s TV productions is considering producing a pilot for a comedy series for a major television network. While the network may reject the pilot and the series, it may also purchase the program for 1 or 2 years. Hale’s payoffs (profits and losses in $1000s) and probabilities of the events are summarized below: What should the company do?
EXPECTED VALUE: EXAMPLE Example 2:
LAWS OF EXPECTED VALUE • The laws of expected value are listed below: • X and Y are random variables • c, c’ are constants • E(X), E(Y), and E(c) are expected values of X, Y and c respectively.
LAWS OF EXPECTED VALUE: EXAMPLE Example 3: If it turns out that each payoff value of Hale’s TV is overestimated by $50,000, what the company should do? Use the answer of Example 2 and an appropriate law of expected value. Which law of expected value applies? Check.
LAWS OF EXPECTED VALUE: EXAMPLE Example 4: Tucson Machinery Inc. manufactures Computer Numerical Controlled (CNC) machines. Sales for the CNC machines are expected to be 30, 36, 42, and 33 units in fall, winter, spring and summer respectively. What is the expected annual sales? Which law of expected value do you use to answer this?
VARIANCE • The variance and standard deviation are obtained as follows: • is the mean (expected value) of random variable X • E[(X-)2] is the variance of random variable X, expected value of squared deviations from the mean • Xi is the i-th possible value of random variable X • p(Xi) is the probability that random variable X will assume the value Xi
VARIANCE: EXAMPLE Example 5: Let X be a random variable with the following probability distribution: Compute variance.
VARIANCE: EXAMPLE Example 5:
SHORTCUT FORMULA FOR VARIANCE • The shortcut formula for variance and deviation are as follows: • = E(X ), the mean (expected value) of random variable X • E(X 2) is the expected value of X 2 and is obtained as follows: • Xi is the i-th possible value of random variable X • p(Xi) is the probability that random variable X will assume the value Xi
SHORTCUT FORMULA FOR VARIANCE EXAMPLE Example 6: Let X be a random variable with the following probability distribution: Compute variance using the shortcut formula.
SHORTCUT FORMULA FOR VARIANCE EXAMPLE Example 6:
LAWS OF VARIANCE • The laws of expected value are listed below: • X and Y are random variables • c, c’ are constants • V(X), V(Y), and V(c) are variances of X, Y and c respectively.
LAWS OF VARIANCE: EXAMPLE Example 7: Let X be a random variable with the following probability distribution: Compute Which law of variance applies? Check.
LAWS OF VARIANCE: EXAMPLE Example 7:
LAWS OF EXPECTED VALUE: EXAMPLE Example 8: Let X be a random variable with the following probability distribution: Compute Which laws of expected value and variance apply? Check.
LAWS OF EXPECTED VALUE: EXAMPLE Example 8:
EXPECTED VALUE AND VARIANCE OF A CONTINUOUS VARIABLE Expected value of a continuous variable: Variance of a continuous variable:
READING AND EXERCISES Lesson 8 Reading: Section 7-1, 7-2, pp. 191-202 Exercises: 7-4, 7-6, 7-15