Download
1 / 20
200 likes | 306 Views
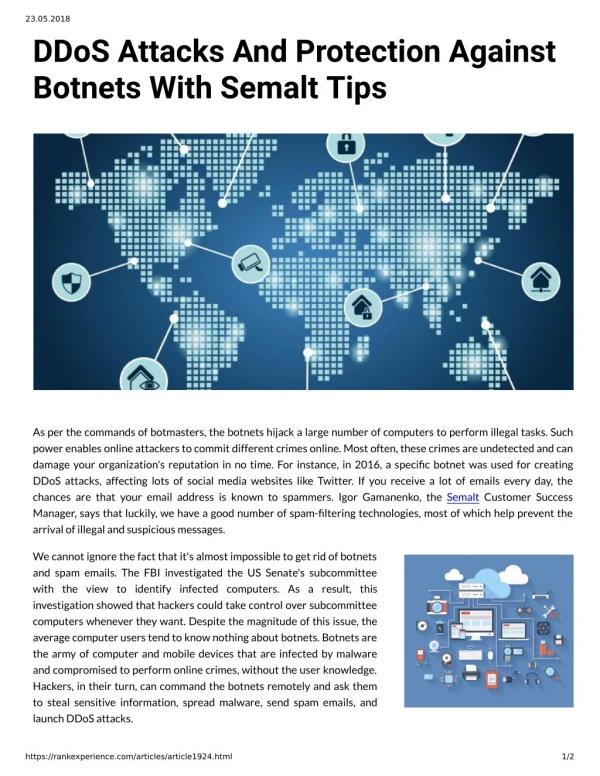
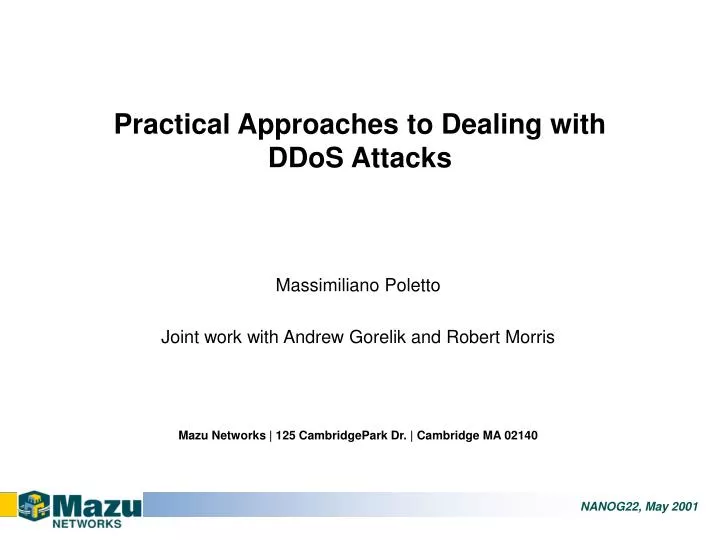
Practical Approaches to Dealing with DDoS Attacks. Massimiliano Poletto Joint work with Andrew Gorelik and Robert Morris Mazu Networks | 125 CambridgePark Dr. | Cambridge MA 02140. AGENDA. This talk will try to address two questions of interest to people who need to manage DDoS attacks:

E N D
Practical Approaches to Dealing with DDoS Attacks Massimiliano Poletto Joint work with Andrew Gorelik and Robert Morris Mazu Networks | 125 CambridgePark Dr. | Cambridge MA 02140
AGENDA This talk will try to address two questions of interest to people who need to manage DDoS attacks: • What are some useful ways of detecting and understanding the nature of DDoS attacks? • Given that it is desirable to deal with DDoS attacks in a distributed manner (e.g. find sources), is there a way to do this that is practical and incrementally deployable?
WHY IS DDoS A DIFFICULT PROBLEM? • Conceptual difficulties • Entire packet except destination address may be random • Filtering on destination address near victim may just reinforce DoS • Moving filtering upstream requires communication • Practical difficulties • Routers don’t have many spare cycles for analysis/filtering • Networks must remain stable—bias against infrastructure change • Attack tracking can cross administrative boundaries • End-users/victims often see attack differently (more urgently) than network operators (“T-3 vs. OC-48”) • Nonetheless, need to: • Maximize filtering of bad traffic • Minimize “collateral damage”
10,000FT OUTLINE • Define attack as activation of one or more “triggers” • E.g.: congestion (drops on a router queue, high traffic rates on a link), unusual traffic mixes, or other metrics of interest • Try to identify DoS traffic (question #1) • Find aggregates [Bellovin et al.] and look at distributions of various packet metrics • Use history to help decrease collateral damage • Where possible, notify other (upstream) network devices (question #2)
AGGREGATES AND TRAFFIC STATISTICS • Bellovin et al.: • “Aggregate” is a collection of packets that share some property • Focus on destination address because it won’t be spoofed • Rate-limit high-volume dest addr aggregates during an attack • Good idea, but filtering by destination address is punitive unless done far from victim • Proposal • Look at other parameters (source addr, ports, other IP fields, hashes of part of payload, packet length) for candidate aggregates • Combine with distributions of parameter values and history information to help decrease collateral damage
EXAMPLE: SOURCE IP ADDRESS • Top: source address distribution of normal incoming traffic for large (400+Kpps) web site • Bottom: source address distribution of incoming traffic during randomly spoofed SYN flood • Normal traffic distributions vary a little from site to site, but consistent per site across time periods at scales >1 minute
DETECTING RANDOMNESS • Useful, e.g., for detecting spoofing • One way is to compute ratio stddev/mean of histogram bucket values (not of histogram itself) • Intuition (for source address example): • Lots of traffic from one source, or clumped as on last slide, has high stddev • Randomly spoofed traffic has low stddev • Divide by mean to normalize for traffic volume • So, lower values mean more randomness • Plots are stddev/mean of source addr histogram bucket values vs. time. • Top: large web site normal traffic • Bottom: randomly spoofed SYN flood • Note Y-axis values: ~20 vs. <1.
USING TRAFFIC HISTORY • Problem: • Distribution of a given parameter (e.g. source address) in normal traffic may not be random (there may be large “spikes”)… • But attack packets may have randomized parameter values… • So biggest aggregates based on that parameter may include a lot of legitimate traffic • Solution: • Many parameter distributions change little over time • Use past distributions of normal traffic for reference • Rate-limit biggest outliers (or values that are historically low) first
TRAFFIC HISTORY EXAMPLE • Source address is a suitable parameter because distributions appear to be consistent across time periods • Top: outside address distribution for 2 months on a corporate T-1 line • Bottom: outside address distribution for 1 day on a corporate T-1 line • If incoming source addresses are random (as determined by observing histogram or computing stddev/mean), first rate-limit biggest outliers or addresses that historically send no traffic
EXAMPLE: IP PROTOCOL • Most traffic is TCP; UDP is often limited to specific services; ICMP is often unimportant • So, traditional smurf/fraggle floods are often the easiest to identify and filter with minimal collateral damage • Top: distribution of different IP protocols at large web site (TCP dominates; some UDP and ICMP) • Bottom: stdev/mean of bucket values changes little over course of a month
EXAMPLE: TTL • TTL distribution has large, predictable spikes below powers of 2 (depends on specific IP implementations) • Stable across time periods; relatively similar for different sites • A crafty attacker may not want to randomize TTLs (improbable TTLs easily identifiable) • Big spikes in TTL distribution are also detectable (increase in stddev/mean at right is due to large file transfers from a small number of hosts)
EXAMPLE: PACKET LENGTH • Top: packet length distribution across a day, large web site • Bottom: stddev/mean of bucket values for minute-length buckets at same site • Packets come primarily in a few lengths (small, ~500 bytes, ~1500 bytes) • Stddev/mean relatively constant • Randomizing packet length or using just one (or few) lengths can be detected relatively easily
DISTRIBUTING DDoS DEFENSE • Now assume you have an answer to question #1: a combination of aggregates computed on different parameters, historical analysis, etc. • But large floods often cannot be solved by a single downstream filter—need to move closer to attackers, filter away from victim • How to do this in a practical, incremental way? • Remember constraints: • Limited router computation budget • Bias against network change (both hardware and software/config) • Multiple administrative domains
EXISTING METHODS/PROPOSALS • Input debugging • Victim identifies attack signature and notifies upstream ISP • Manual egress filtering and interface testing • (ICMP) Traceback [Savage et al. 2000, Bellovin 2000] • Routers probabilistically annotate packets (or send ICMP packets) with their identity and other information • Destination can reconstruct path of large volumes of traffic • Pushback [Bellovin et al. 2001] • Routers identify aggregates and send rate-limit requests upstream • Status messages about ongoing traffic rates flow downstream • CenterTrack [Stone 2000] • Edge routers reroute traffic via IP overlay network to tracking router(s) • Tracking routers diagnose attack and optionally filter traffic
(POTENTIAL) PROBLEMS • Input debugging is used today but is slow and coarse; requires extensive human intervention • Traceback and (especially) pushback require considerable changes to large fraction of router installed base • Traceback effectiveness decreases with increasing fan-out and hop count; it has authentication/spoofing problems • Pushback combines source identification with filtering, which raises difficult inter-domain adminstration issues • As currently defined, pushback stops at the first router that does not implement it • CenterTrack has a potential bottleneck (tracking routers) and may be detectable by attackers
A COMPLEMENTARY NEAR-TERM APPROACH “Distributed monitoring” • Monitor key links using taps and dedicated monitor devices • Store traffic state (logs) on monitors: enable historical analysis with no central repository • Implement hierarchical communication between monitors • Encourage open standards for communication between monitors • Separate filtering from monitoring • Possibly separate filtering from routing and routers (employ dedicated filtering device) • Ensure human in loop during filtering to decrease risk of inadvertent DoS
RELATION TO EXISTING SCHEMES • Pragmatic, incrementally deployable improvement to input debugging • Effectively a separate network for fast, precise monitoring • Filtering can be implemented via routers (like manual input debugging today) or via dedicated (“firewall-like”) filtering devices • Complements ambitious designs like pushback/traceback • Emphasis on near-term feasibility • Could benefit from traceback information
BENEFITS • Dedicated passive monitors with taps • Add no latency or load on routers • Increase visibility into traffic (vs. what is available from routers) • Require no change to deployed devices • Allow incremental deployment with minimal change to infrastructure • Are invisible to attackers • Hierarchy and point-to-point communication among monitors • Remove need for physical adjacency as in pushback • Simplify problem of inter-domain authentication • Filtering via routers: can work today • Filtering via dedicated devices: is fast, fine-grained; allows routers to focus on routing
CHALLENGES • Requires investment in devices beyond current infrastructure • Filtering via routers is • Slow as always • Limited by expressiveness of ACL languages • Filtering via dedicated filter device introduces new network element and point of failure • Need to define open standards for inter-monitor communication
CONCLUSION • Computing aggregates for many parameters and using historical information are promising methods of identifying DDoS traffic and decreasing collateral damage • Tracking DDoS attacks towards their sources is difficult and time-consuming • Distributed monitoring is a more efficient and accurate form of input debugging while we wait out the deployment issues and technical challenges of other proposed solutions • Interoperability between different devices that detect/track DDoS traffic is fundamentally important