Download
1 / 37
370 likes | 469 Views
Quality Measures (Annual Dental, Dental Varnishing, ED Utilization, WCV) New Measures (BMI, ABCD, Autism, Soc-Emot) Survey Results (Provider, Mental Health, OSI). Pre-work Baseline Data Analysis. Reported as visits per 1000 Member Months Max ED Utilization at 131

E N D
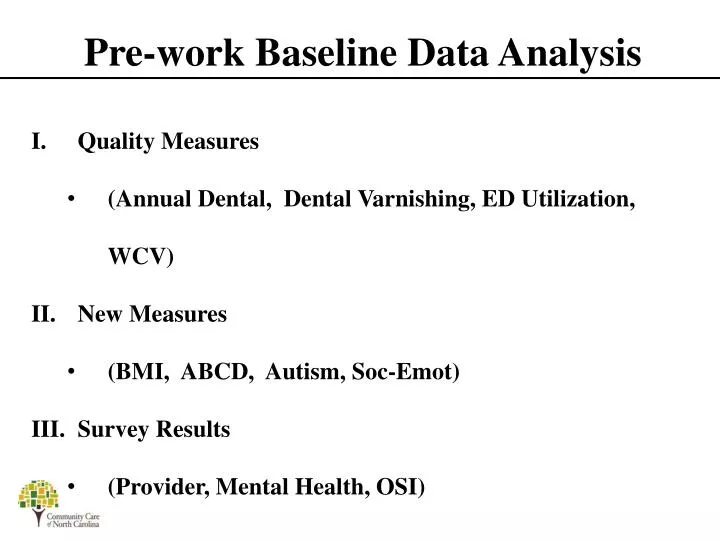
Quality Measures • (Annual Dental, Dental Varnishing, ED Utilization, WCV) • New Measures • (BMI, ABCD, Autism, Soc-Emot) • Survey Results • (Provider, Mental Health, OSI) Pre-work Baseline Data Analysis
Reported as visits per 1000 Member Months • Max ED Utilization at 131 • Min ED Utilization 62 Baseline Quality Measures – ED Utilization Service Date: 10/1/09 – 9/30/10
Peak at ages 7-10 and then decline… • This is a measure of patients that had at least one dental visit during the measurement period Baseline Quality Measures – Annual Dental Service Date: 10/1/09 – 9/30/10
On average 63% are receiving 3 or more varnishes and 44% are receiving 4 or more • Graphs show percent of patients with 3+ and 4+ varnishes in first 42 months of life Baseline Quality Measures – Dental Varnish Service Date: 10/1/09 – 9/30/10 Service Date: 10/1/09 – 9/30/10
On average our practices see more 3-6 year olds for Well Child Visits • On average 3-6 year olds are getting more of their expected visits Baseline Quality Measures – Well Child Visit Service Date: 10/1/09 – 9/30/10
Baseline Quality Measures – Well Child • Most of the children have had 3+ visits at 15 Months Service Date: 10/1/09 – 9/30/10
Quality Measures • (Annual Dental, Dental Varnishing, ED Utilization, WCV) • New Measures • (BMI, ABCD, Autism, Soc-Emot) • Survey Results • (Provider, Mental Health, OSI) Pre-work Baseline Data Analysis
Reporting percent of health check visits that had the necessary development screen Baseline Results - ABCD Max 93% Service Date: 10/1/10 – 12/31/10
Reporting percent of health check visits that had the necessary MCHAT screen for age range 18 – 30 months Baseline Results - Autism Service Date: 10/1/10 – 12/31/10
PSC Covers ages 6 – 10 • Brightfutures ages 11 - 20 WCV School Age & Adolescent Screen Max 3.86% Max 3.81% Service Date: 10/1/10 – 12/31/10 Service Date: 10/1/10 – 12/31/10
BMI V Code usage low state-wide • Coding for this will help to show Meaningful Use Baseline Results - BMI Service Date: 10/1/09 – 9/30/10
Quality Measures • (Annual Dental, Dental Varnishing, ED Utilization, WCV) • New Measures • (BMI, ABCD, Autism, Soc-Emot) • Survey Results • (Provider, Mental Health, OSI) Pre-work Baseline Data Analysis
Average percentage of total possible score decreases as you move from left to right • Average overall score was 14 out of 21 possible points Office Systems Inventory Tool
Average scores range from 71% of the total possible in the “Clinical IS” domain to 58% in “Community Resources” • Average overall score was 62 out of a possible 96 Mental Health Practice Readiness
Practice Type and Location? Baseline Survey Results – Provider
What proportion (percent%) of your practice population is: Baseline Survey Results – Provider Racial/ethnic minority 20% - 95% <=200% Federal Poverty Level 15% - 90% 0- 11 Years Olds 5% - 80% 12 – 21 Years Olds 20% - 75%
Estimate the number of children/youth you see per month presenting for the first time with: Baseline Survey Results – Provider
Estimate the number of children/youth you see per month where you would consider or make the following diagnosis: Baseline Survey Results – Provider #1 ADHD 57% said 5 or more, w/ 25% > 15 #2 Language/communication problems 60% said 5 or more #3 Developmental disabilities 52% said 5 or more #4 Mood disorders 21% said 5 or more #5 Autism spectrum disorders 11% said 5 or more #6 Substance abuse 7% said 5 or more #7 Attachment disorders 5% said 5 or more #8 PTSD 2% said 5 or more
Please rate your level of comfort in screening and/or diagnosing children/youth who present with: behavior, soc-emot, ADHD… Baseline Survey Results – Provider • 86% ADHD and 92%Developmental Disabilities “Comfortable” or “Very Comfortable” • 82% PTSDand77% Attachment Disorders “Uncomfortable” or “Very Uncomfortable”
Please rate your level of comfort in managing children/youth with: behavior, soc-emot, ADHD… Baseline Survey Results – Provider • 85% Developmental Disabilitiesand 83% Language and ADHD “Comfortable” or “Very Comfortable” • 88% PTSD and 85% Attachment Disorders “Uncomfortable” or “Very Uncomfortable”
Please rate your level of skill in screening and/or diagnosing children/youth who present with: behavior, soc-emot, ADHD… Baseline Survey Results – Provider • 87% ADHD and 85%Developmental Disabilities “Proficient” or “Highly Proficient” • - Also highly skilled with behavior and language problems • 82% Attachment Disorders and 77% PTSD “Limited” or “Very Limited”
Please rate your level of effectiveness in managing children/youth with: behavior, soc-emot, ADHD… Baseline Survey Results – Provider • 85% ADHD and 79% Language/Communication “Proficient” or “Highly Proficient” • 81% PTSD and 80% Substance Abuse • “Limited” or “Very Limited”
We would like to know what you usually tend to do when confronted with a child/youth who presents with: Behavior problems, Social-emotional difficulties, ADHD…. Baseline Survey Results – Provider • “Evaluate & Manage Yourself” • 60% ADHD • 25% Behavioral Problems • 13% Social-emotional difficulties • “Evaluate & Refer Management” • 38% Language, Autism spectrum disorders • 36% Substance Abuse • 33% Developmental Disabilities • “Refer out for Evaluation & Management” • 49% Attachment disorders & PTSD • 38% Substance abuse • 25% Language problems
How satisfied do you feel in your role as a provider of care to children and families with behavioral and emotional problems? Baseline Survey Results – Provider • 46% “Unsatisfied or Very Unsatisfied” of which: • 94% said constraints with the healthcare system • 45% lack knowledge and skills for dealing with these problems • 34% do not like evaluating and treating these patients • “Not enough training in behavior issues”
Challenges or obstacles to you in providing effective care to children/youth with behavior and emotional problems. Baseline Survey Results – Provider • Top 5 reasons were: • Lack of time required for patient care • Lack of access to specialist medical consultations (e.g. psychiatrists) • Difficulty in contacting teachers, social workers and other community professionals • Lack of access to patient/community treatment resources • Lack of remuneration received for patient care • “Lack of good home environment/parents w/ appropriate priorities/etc.” • “Multiple co-morbidities.”
Which measures/interventions would help or assist you to provide better care to the children/youth with psychosocial problems in your practice: Baseline Survey Results – Provider • Top 5 reasons were: • Scheduled educational meeting or event • Education outreach visit to your practice by an expert in the field • Better access to medical specialist consultant support • Different fee (billing) codes to remunerate for time required for patient care • Patient/community resources list for your area
Please indicate your beliefs about primary care management of children and youth with psychosocial problems: Baseline Survey Results – Provider • 88% Agreed that the primary care physician is uniquely positioned to address these issues with family because of their longitudinal relationship. • 75% These problems/conditions are usually related to stresses in the family which are hard to manage • 50%/50% Diagnosis of these problems is Often subjective and difficult
Do you have established relationships with mental health professionals in your area? • 85% Yes • 15% No • Do you receive feedback from the mental health professionals when you make a referral? • 70% Yes • 30% No Baseline Survey Results – Provider
What is the quality of you communication with mental health professionals? Baseline Survey Results – Provider 18% 33% 30% 20% Poor Average Good Very Good
Please indicate your level of knowledge of community resources for children and youth with behavior, emotional, and/or psychosocial problems. Baseline Survey Results – Provider 0% 43% 45% 13% Minimal Extensive
Please indicate your level of comfort making referrals to community resources for children and youth with behavior, emotional, and/or psychosocial problems: Baseline Survey Results – Provider 0% 10% 58% 33% Minimal Extensive
Does your practice use a formal developmental/behavioral screening tool periodically with each child or adolescent 0 to 21 years old? Baseline Survey Results – Provider • 88% Yes • 12% No
Which tools does your practice use? Baseline Survey Results – Provider
How frequently do children /adolescents in your practice receive these screenings? Baseline Survey Results – Provider • Of the 19 providers that use the ASQ, 84% say they use it routinely at specified Well Visits • Of the25 providers that use the PEDS, 92% say they use it routinely at specified Well Visits • Of the 32 providers that use the MCHAT,94% say they use it routinely at specified Well Visits • Of the 10 providers that use the PSC, 30% say they use it routinely at specified Well Visits • Of the 14 providers that use the Edinburgh, 71% say they use it routinely at specified Well Visits • Of the 7 providers that use the Brightfutures, 57% say they use it routinely at specified Well Visits • Of the 7 providers that use the GAPS,57% say they use it routinely at specified Well Visits
How frequently do children /adolescents in your practice receive these screenings? Baseline Survey Results – Provider • Of the 4 providers that use the PHQA, 25% say they use it routinely at specified Well Visits • Of the 6 providers that use the CRAFFT, 50% say they use it routinely at specified Well Visits • Of the 29 providers that use the Vanderbilt, 10% say they use it routinely at specified Well Visits • Of the 11 providers that use the Conner’s Scale, 9% say they use it routinely at specified Well Visits • Of the 5 providers that use the SDQ, 20% say they use it routinely at specified Well Visits
How frequently do families of children/adolescents with, or at risk for, developmental delay(s) receive information on early intervention (0-5 year olds)/school-based interventions or community programs (6-20 years old)? Baseline Survey Results – Provider Never Never Rarely Rarely Sometimes Sometimes 0-5 year olds 2% 0% 0% 7% 14% 37% 54% 86% Routinely Routinely 6-20 year olds
How frequently do families of children/adolescents with, or at risk for, developmental/social-emotional, behavioral/mental health problems receive information on family support services (e.g. Family Support Network, NAMI, Family Voices, Autism Society, etc.)? Baseline Survey Results – Provider Never Never Rarely Rarely Sometimes Sometimes 0-5 year olds 2% 0% 21% 33% 56% 51% 14% 23% Routinely Routinely 6-20 year olds